Appearance
Slope Classification Tool
Overview
The Slope Classification Tool analyses terrain slope distribution within a user-defined area. It classifies each pixel of the terrain into slope degree ranges and returns a breakdown of pixel counts and percentages, helping forestry professionals determine whether an area qualifies as "steep country" under regulatory guidelines.
Key Features
- Flexible Area Definition: Draw custom polygons, select existing polygons from a layer, or use preset box and circle shapes
- Layer Selection: Choose from any visible polygon layer (Feature Layer or Map Image Layer with polygon sublayers) as a source for area selection
- Custom Degree Ranges: Toggle custom slope classification ranges with editable min/max degrees and labels
- Interactive Shape Editing: Resize and reposition analysis areas with transform tools
- Real-Time Area Display: See the current analysis area in hectares while drawing and editing
- Proportional Results Table: Slope distribution results with pixel counts, percentages, and proportional bar chart
- Detailed Report Dialog: Cumulative frequency chart, tabular summary with area calculations, and regulatory definitions
- Steep Country Classification: Automatic determination based on the 20-degree majority slope threshold (per Forest Practices Code 2020)
How to Use the Slope Classification Tool
Accessing the Tool

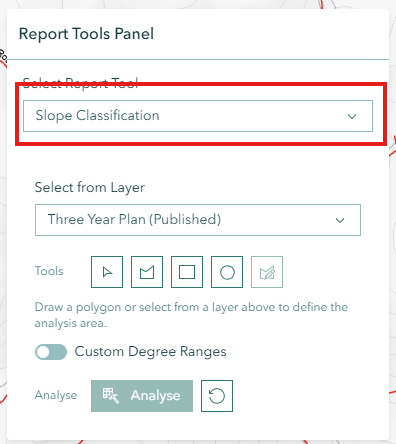
- Navigate to the Report Tools panel in the right sidebar
- Select Slope Classification from the report tools dropdown
- The tool panel opens showing layer selection, drawing tools, and analysis options
Selecting a Source Layer
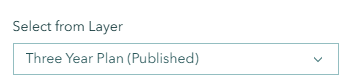
The layer dropdown lists all visible polygon layers on the map. Select a layer to enable the Select from Layer tool, which lets you click on a polygon in that layer to use as your analysis area.
INFO
If no layers appear in the dropdown, ensure at least one polygon layer is visible on the map.
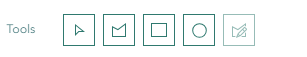
Defining Your Analysis Area
You have four ways to create an analysis area. When a tool is active, a contextual hint appears below the toolbar to guide you (e.g., "Click to add vertices on the map. Double-click or click the first point to finish the polygon.").
Option 1: Select from Layer
- Choose a polygon layer from the dropdown
- Click the Select from Layer button (cursor icon)
- Click on a polygon in the map belonging to that layer
- The tool attempts to retrieve the polygon using a multi-step fallback: first a direct hit-test, then a spatial query on the Feature Layer, and finally an identify operation for Map Image Layers
- The polygon is highlighted and its area is displayed
Best for: Using existing boundaries such as coupes, cadastre parcels, or management units
Option 2: Draw a Custom Polygon
- Click the Draw Polygon button (polygon icon)
- Click points on the map to define your boundary
- Continue clicking to add vertices as needed
- Double-click to complete the polygon (or press ESC to cancel)
Best for: Irregular areas, custom boundaries, specific study areas
Option 3: Create a Preset Box
- Click the Rectangle button to create a preset box (default size: 50m x 50m)
- The box appears centred on your current map view
- The shape automatically enters edit mode for immediate adjustment
- Resize using corner handles or reposition by dragging (rotation is disabled; aspect ratio is locked)
- Maximum dimension is 2000m — a warning appears if exceeded
Best for: Rectangular sample areas, standard plot shapes
Option 4: Create a Preset Circle
- Click the Circle button to create a preset circle (default radius: 25m)
- The circle appears centred on your current map view
- The shape automatically enters edit mode for immediate adjustment
- Resize using edge handles or reposition by dragging
- Maximum dimension is 2000m — a warning appears if exceeded
Best for: Circular sample plots, radial studies
Editing Your Analysis Area
- Click the Edit Geometry button (edit icon) to activate edit mode
- For drawn polygons: reshape by moving individual vertices
- For preset shapes: use transform handles to resize and move (rotation is disabled)
- Click elsewhere on the map or toggle the edit button to finish editing
- The area display updates in real time as you edit
WARNING
Preset shapes have a maximum dimension of 2000m. A warning appears if you exceed this limit during editing, and the edit is cancelled.
Custom Degree Ranges
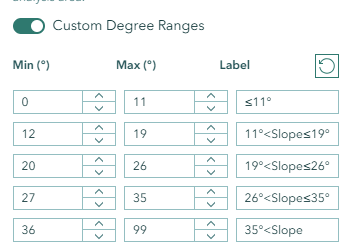
By default the tool uses the following slope classification ranges:
| Range | Min | Max | Label |
|---|---|---|---|
| 1 | 0° | 11° | ≤11° |
| 2 | 12° | 19° | 11°<Slope≤19° |
| 3 | 20° | 26° | 19°<Slope≤26° |
| 4 | 27° | 35° | 26°<Slope≤35° |
| 5 | 36° | 99° | 35°<Slope |
To customise:
- Toggle the Custom Degree Ranges switch
- An editable table appears with columns for Min, Max, and Label
- Adjust the degree values and labels as needed
- Click the Reset button to restore default ranges
Selecting a Slope Layer
The Slope Layer segmented control lets you choose which slope data source to use for analysis:
- Slope (default): Uses the primary slope raster (
STT:Slope_tiffs) - Slope VT: Uses an alternative slope raster (
STT:Slope_vt)
Select the appropriate layer before running the analysis.
Running the Analysis
- Ensure your analysis area is defined (area displayed in hectares)
- Optionally configure custom degree ranges
- Click the Analyse button (raster analysis icon)
- Wait while the analysis processes (loading indicator appears)
- Results display in a card below the tools
Understanding Your Results
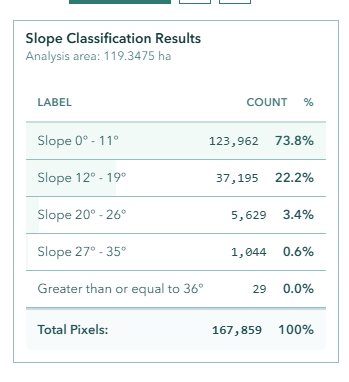
The results card shows a table with:
| Column | Description |
|---|---|
| Label | The slope classification range (e.g., "≤11°", "11°<Slope≤19°") |
| Count | Number of pixels in that slope range |
| % | Percentage of total pixels in that range |
A proportional bar behind each row provides a visual comparison of the distribution. The footer shows the total pixel count.
Slope Report Dialog

Click the View Report button (chart icon) after analysis to open the detailed Slope Report Dialog. The dialog is resizable and draggable, and contains three tabs:
Chart Tab
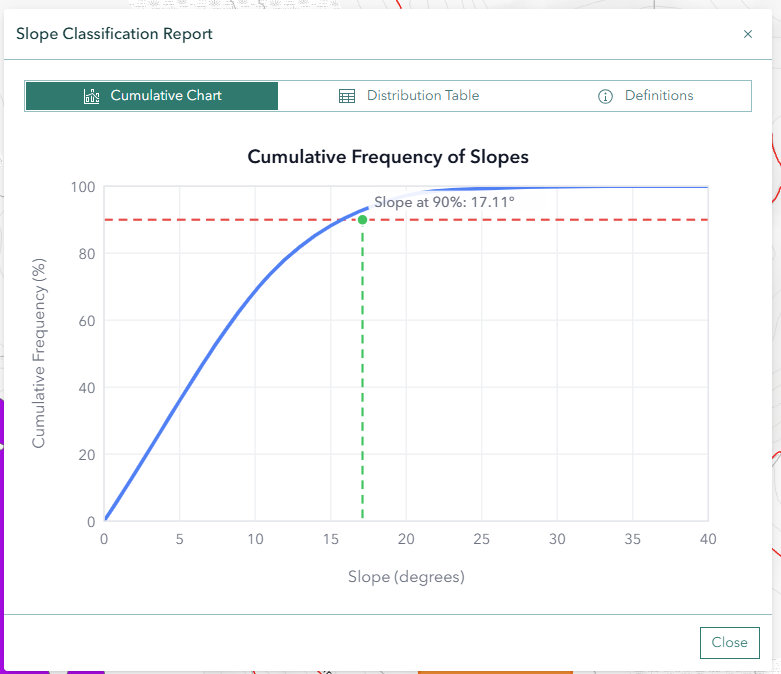
Displays a cumulative frequency curve showing the relationship between slope degrees and the cumulative percentage of pixels:
- Blue curve: Cumulative frequency line (monotone cubic spline)
- Red dashed line: 90% threshold — the line at which "majority slope" is evaluated
- Green dashed line: Majority slope value — the degree at which 90% of pixels are at or below
- Intersection dot: Where the curve meets the 90% threshold
- Annotation: Displays the calculated majority slope value in degrees
Table Tab
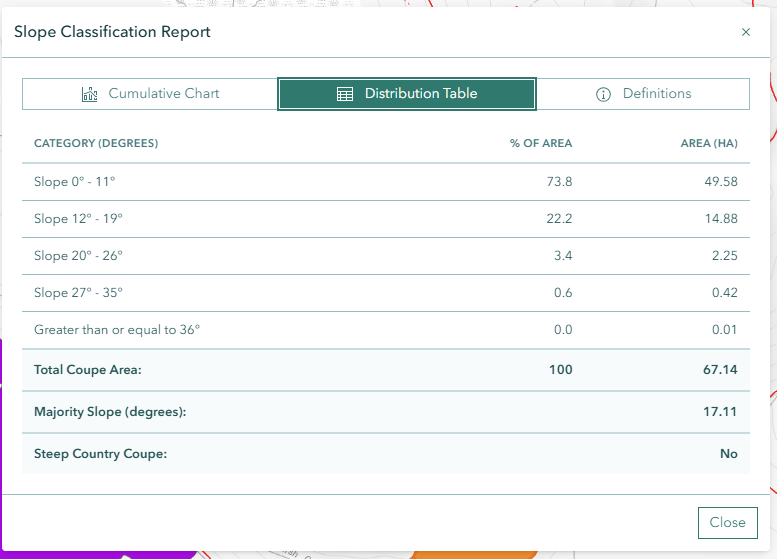
Shows a tabular breakdown of slope ranges with:
- Category: Slope classification label
- %: Percentage of pixels in the range
- Area (ha): Area in hectares for the range (calculated from pixel count; each pixel represents a 2m x 2m = 4m² cell)
The table footer includes:
- Total analysed area in hectares
- Majority slope value in degrees
- Steep country classification: Yes (highlighted in red) if the majority slope is 20 degrees or above, No otherwise
Definitions Tab
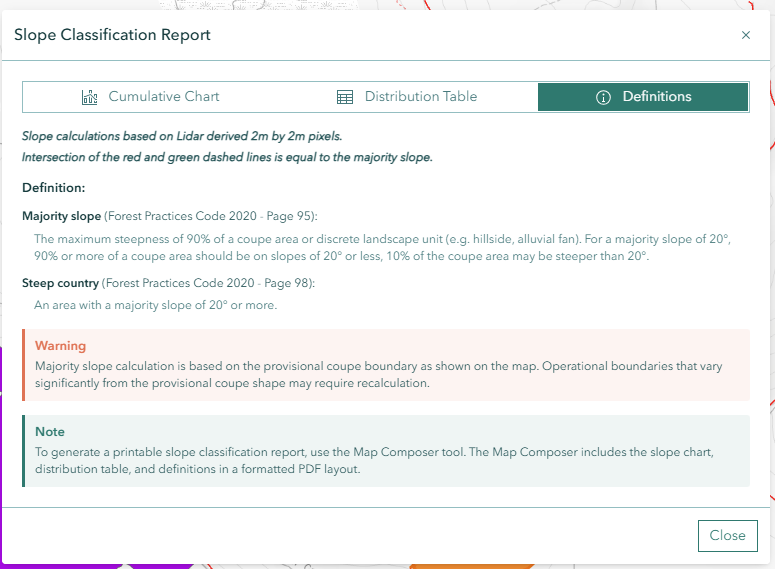
Provides regulatory definitions and explanatory notes:
- Majority slope: The slope value at which 90% of the area (by pixel count) is at or below that gradient
- Steep country: Defined as terrain where the majority slope is 20 degrees or greater
- Warning: Notes that boundaries shown are provisional and may differ from final survey boundaries
- Map Composer note: Directs users to Map Composer for generating printable slope classification reports
Troubleshooting
| Issue | Solution |
|---|---|
| Analyse button is disabled | Draw or select an analysis area first (area must be > 0 ha) |
| No layers in dropdown | Ensure at least one polygon layer is visible on the map |
| "No geometry" error | Draw or select an analysis area before clicking Analyse |
| Analysis fails with error | Try simplifying your polygon or reducing the area size |
| Edit mode won't activate | Ensure an analysis area exists on the map |
| Size limit exceeded warning | Reduce preset shape size to within the maximum dimension |
| Select from layer not responding | Ensure you have selected a layer from the dropdown first |
| Results seem incorrect | Verify analysis area is within DEM data coverage |
| Report dialog is empty | Run the analysis first, then click View Report |
Frequently Asked Questions
Q: What is "majority slope"? A: Majority slope is the slope value at which 90% of the area (measured by pixel count) is at or below that gradient. It is the 90th percentile of the slope distribution within the analysis area.
Q: What defines "steep country"? A: An area is classified as steep country when the majority slope is 20 degrees or greater. This threshold is based on forestry regulatory guidelines.
Q: Can I use Map Image Layer polygons for area selection? A: Yes. The tool supports both Feature Layers and Map Image Layers with polygon sublayers. For Map Image Layers, the tool uses an identify operation to retrieve the polygon geometry when you click on the map.
Q: How accurate is the slope analysis? A: The analysis uses a pre-computed slope raster derived from DTM data, published to GeoServer. Accuracy depends on the resolution and quality of the underlying DTM. The geometry is reprojected to EPSG:28355 for analysis.
Q: Can I change the slope ranges? A: Yes. Toggle the Custom Degree Ranges switch to edit the min/max values and labels for each classification range. Click the Reset button to restore the defaults at any time.
Q: How do I get a printable report? A: Use Map Composer for generating printable slope classification reports. The Slope Report Dialog in Horizon provides an interactive preview of the chart and table data.