Appearance
Feature Table
Overview
The Feature Table displays attribute data from a selected map layer in an interactive table. You can spatially filter the table by drawing or selecting a geometry on the map — only features that intersect the geometry are shown. The table supports sorting, column visibility, and export.
Key Features
- Spatial filtering: Draw or select a polygon, circle, or rectangle to filter the table to intersecting features
- Buffer support: Expand a point or line geometry by a specified distance before filtering
- Layer support: Works with Feature Layers and Map Image Layer sublayers
- Measure toggle: Display live area measurements while drawing
- Export CSV (all selected rows): Export every selected row to CSV — batched and cancellable, so a "Select all" of tens of thousands of features exports them all, not just the ~2,000 the ArcGIS API's own CSV export is capped at
- Export: Download filtered results as SHP or KML via the layer context menu
Accessing the Tool
- Click the Feature Table icon in the right panel toolbar

Toolbar Buttons
The Feature Table toolbar appears at the top of the panel and provides geometry input and control buttons:
| Button | Tooltip | Description |
|---|---|---|
| Select Shape | Select Shape | Click on the map to select an existing polygon feature as the filter boundary |
| Draw Polygon | Draw Polygon | Click vertices on the map to draw a custom polygon |
| Draw Circle | Draw Circle | Click and drag to draw a circular boundary |
| Draw Rectangle | Draw Rectangle | Click and drag to draw a rectangular boundary |
| Edit Shape | Edit Shape | Edit the vertices of the current drawn or selected shape |
| Measure toggle | Show area while drawing | Display a live area label (hectares or m²) while drawing |
| Filter Features | Filter Features | Apply the geometry filter and open the Feature Table dialog |
| Reset | Reset | Clear the current geometry and reset the tool |
| Fullscreen | Open fullscreen | Expand the Feature Table dialog to fullscreen |
Buffer
The Buffer section appears below the toolbar after a geometry has been drawn or selected. Use it to expand a point, line, or polygon geometry by a fixed distance before filtering.
Points and lines must be buffered before they can be used as spatial filters against polygon layers.
| Control | Description |
|---|---|
| Distance input | Enter the buffer distance (must be greater than 0) |
| Unit selector | Choose the unit: Meters, Kilometers, Feet, or Miles |
| Apply button | Applies a geodesic buffer to the current geometry on the map |
Using the Feature Table
Step 1: Draw or Select a Geometry
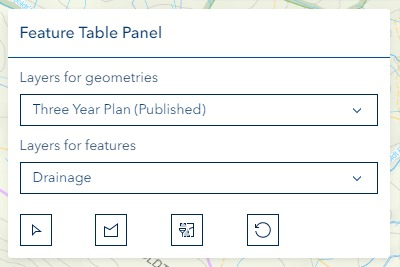
Use the toolbar buttons to define the spatial filter boundary:
Select an existing polygon from the map by clicking Select Shape then clicking a feature

Draw a custom boundary using the Draw Polygon, Circle, or Rectangle buttons

Step 2: (Optional) Apply a Buffer
If your geometry is a point or line, enter a buffer distance and unit, then click Apply to convert it to a polygon before filtering.
Step 3: Filter Features
Click Filter Features to open the Feature Table dialog. The table shows all features from the selected layer that intersect the drawn geometry.

Feature Table Dialog
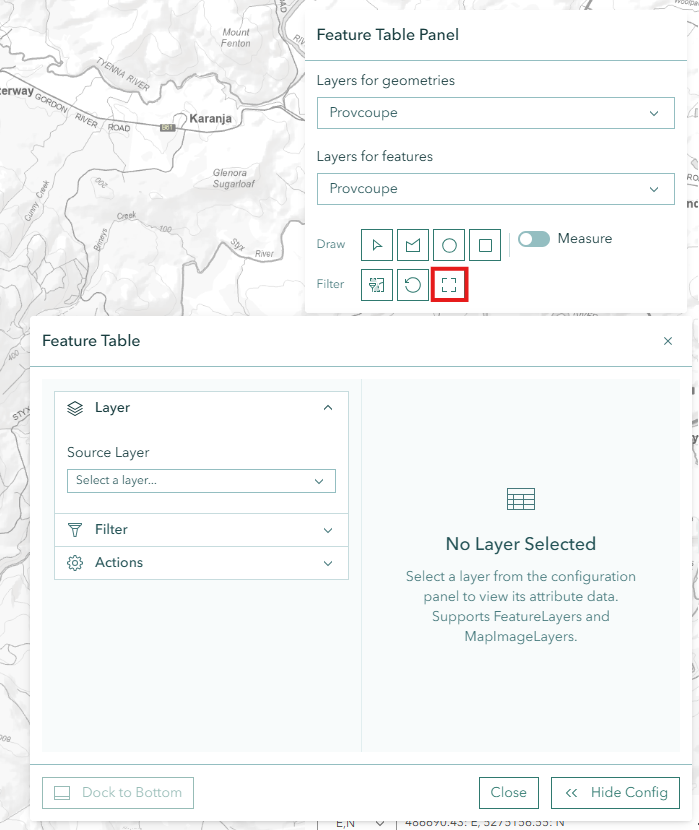
The Feature Table opens in a draggable, resizable dialog. The heading shows the selected layer name and field count (e.g., "Feature Table — Properties Layer (15 fields)").
The dialog is non-modal — you can continue interacting with the map while the table is open.
Left sidebar accordion panels:
- Layer — Select the source layer to display in the table
- Filter — Configure an attribute filter (Basic or Advanced)
- Actions — Data management actions for the table
Main area — the interactive attribute data table with sorting and selection.
Selecting Rows
A selection toolbar sits above the table, with a live selection count. It controls which rows the Export CSV button will export.
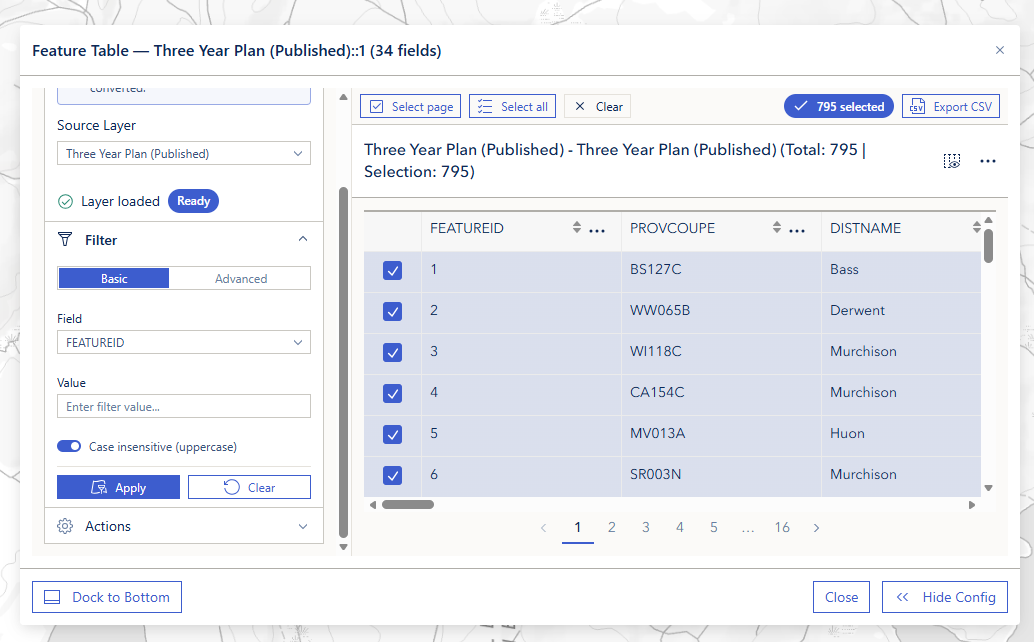
| Control | Description |
|---|---|
| Select page | Select every row on the current page only |
| Select all | Select every matching row across all pages, respecting the active filter (e.g. all 795 features, not just the visible page) |
| Clear | Clear the current selection |
| N selected | A live badge showing how many rows are currently selected |
| Export CSV | Export all selected rows to a single CSV file — see Export CSV (all selected rows) |
Data Management
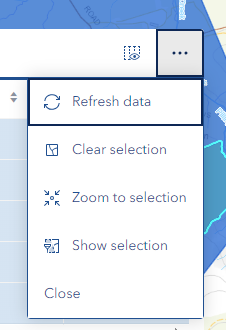
Click the Three-Dots (⋮) menu icon in the table toolbar for data management options:
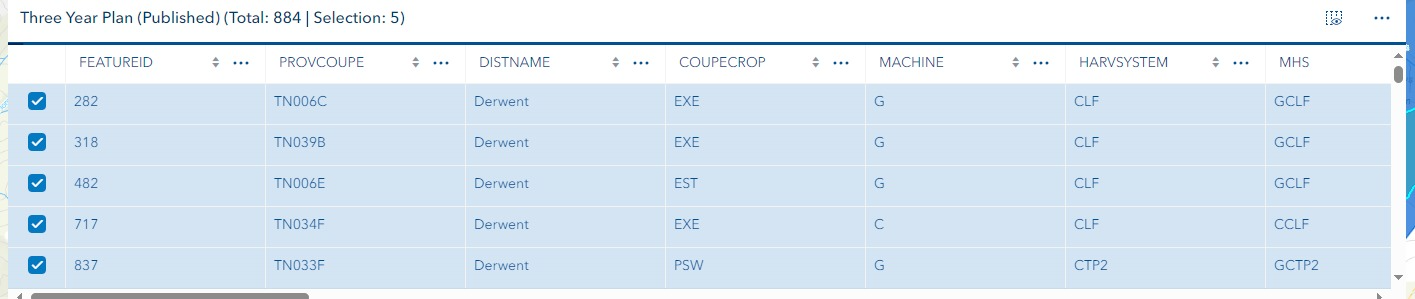
| Option | Description |
|---|---|
| Refresh Data | Reload the table data from the layer |
| Clear selection | Deselect all selected rows |
| Zoom to Selection | Zoom the map to the selected features |
| Show Selection | Filter the table to show only selected rows |
| Export selection to CSV | The ArcGIS JS API's built-in CSV export — a single request capped at ~2,000 rows. For larger selections use the Export CSV button instead (see Export CSV (all selected rows)) |
Export CSV (all selected rows)
The Export CSV button (next to the selection count, brand-blue outline, CSV icon) exports every selected row to a single CSV file — not just the rows on the current page.
This is not the ArcGIS API's CSV export
The ArcGIS Maps SDK for JavaScript (JS API) FeatureTable has its own built-in "Export selection to CSV" (in the three-dots ⋮ menu). That one issues a single query capped by the service's record limit, so it exports at most ~2,000 rows — if your selection is larger, it silently keeps only the first ~2,000.
Horizon's Export CSV button works around that: it fetches the selected features in batches (each kept under the service limit) and assembles the CSV in your browser, so it downloads every selected row — however many that is.
What's in the CSV:
- All exportable fields in the layer (geometry, blob, and raster columns are skipped), using each field's alias as the column header
- Coded-value domains are translated to their labels — the CSV shows what the table shows (e.g. "Hardwood"), not the raw stored code
- Date fields are written as ISO timestamps
- A UTF-8 byte-order mark is added so Excel reads accented characters correctly
- Values are safely quoted (RFC 4180) and protected against spreadsheet formula injection (a cell starting with
=,+,-, or@is neutralised so it can't run as a formula when opened in Excel/Sheets)
The file name is <LayerTitle>_selected_<count>.csv (the layer title is sanitised to safe characters).
Progress & cancel:
- A progress bar with a live "Exporting X of Y (Z%)" count appears under the toolbar during the export
- A Cancel button (red outline) appears next to Export CSV while it runs — click it to stop a large export immediately
- The export also stops cleanly if you close the table dialog mid-export
When the button is enabled: only when there is an active selection (use Select page or Select all first). It is disabled while a selection is in progress or while an export is already running.
TIP
To export all rows, click Select all (which selects every feature across every page, respecting the active filter), then click Export CSV.
Other formats (Shapefile / KML)
For geometry-bearing exports, use the Filter Tool → Statistics & Export (or the Filter Editor's Statistics & Export tab).
Troubleshooting
| Issue | Solution |
|---|---|
| Table not populating | Verify a layer is selected and the filter geometry is valid |
| Filter button disabled | Draw or select a geometry first |
| Buffer Apply button disabled | Ensure a geometry is present and distance is greater than 0 |
| Points/lines not filtering | Buffer the geometry first — only polygon boundaries can filter area layers |
| Layer not in dropdown | Ensure the layer is visible on the map |
| A Sketch layer lists other people's sketches | Fixed in v2.29.0 — the table shows only your own sketches. Still seeing them? Reload the browser to pick up the latest version |
| Clear brought back rows the map is not showing | Fixed in v2.29.0. Clear now removes only the filter you typed; the layer's own restrictions — your Sketch layers, and any filter applied in the Filter Tool — stay in place |
| Export CSV button disabled | Select rows first with Select page or Select all; the button is also disabled while an export is already running |
| CSV only has the first ~2,000 rows | You used the three-dots Export selection to CSV (the ArcGIS JS API export, capped at ~2,000). Use the Export CSV button next to the selection count to get all selected rows |
Video Tutorials
Creating a Feature Table from a Custom Polygon
Creating a Feature Table from a Selected Polygon
See Also
- Filter Tool - Apply attribute and spatial filters to layer data
- Area Summary Tool - Generate area calculations with geometry intersection analysis
- Chart Tool - Create charts and visualisations from layer attribute data