Appearance
Horizon Analyst
Overview
Horizon Analyst is a sophisticated companion application that extends Horizon's analytical capabilities through advanced data visualization and bi-directional communication. This powerful tool provides specialized features for in-depth spatial data examination, interactive reporting, and enhanced data analysis workflows that seamlessly integrate with your main mapping interface.
Core Features
Analysis Tools
- Bi-directional Data Exchange: Real-time communication between Horizon and Analyst through SignalR integration
- Advanced Visualization: Comprehensive charting capabilities including pie charts and bar graphs for attribute analysis
- Interactive Table Analysis: Enhanced table visualization with column configuration and data filtering
- Dynamic Data Selection: Flexible geometry-based data filtering with multiple input methods
- Report Generation: Customizable reports based on spatial queries and attribute analysis
- Multi-Window Support: Independent browser window operation for enhanced workflow flexibility
Interface Options
- Separate Window Mode: Opens in dedicated browser window for dual-monitor setups
- Integrated Communication: Maintains persistent connection with main Horizon application
- Responsive Layout: Adapts to various screen sizes and window configurations
- Synchronized Data Updates: Real-time updates when data changes in either application
- Context Preservation: Maintains analysis state across window interactions
Setup Process
Initial Access
- Navigate to the Report Tools panel in the right sidebar
- Select Horizon Analyst from the report type dropdown
- Click the Open Horizon Analyst button (launch icon) to open the companion app in a new browser window
- Position the window as needed (supports dual-monitor setups)

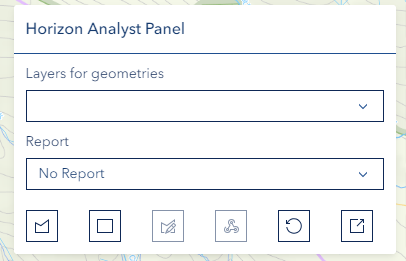
Panel Controls
The Horizon Analyst panel contains two dropdowns and a toolbar for defining and sending geometry to the Analyst application.
Dropdowns
| Control | Purpose |
|---|---|
| Layers for Shapes | Select a visible map layer to use as the source for shape selection. Supports Feature Layers, CSV layers, and Map Image Layer sublayers. Click the dropdown to refresh the layer list. |
| Report | Select the report type to display in the Analyst application. |
Toolbar Buttons
| Button | Icon | Description |
|---|---|---|
| Select Shape | cursor / cursor-selection | Click a polygon feature on the map from the selected layer to use as the analysis geometry. Only visible when a layer is selected. |
| Draw Polygon | polygon | Draw a custom polygon boundary on the map by clicking vertices. Double-click to complete. |
| Draw Rectangle | rectangle | Draw a rectangular boundary with two clicks. |
| Edit Shape | edit-geometry | Modify an existing drawn or selected shape. Disabled until a shape is on the map. |
| Filter Features | webhook | Send the current geometry to Horizon Analyst to filter and update the report data. Disabled until a shape is on the map. |
| Reset | reset | Clear all graphics from the map and reset the panel. |
| Open Horizon Analyst | launch | Open the Horizon Analyst companion application in a new browser window. |
Data Analysis
Basic Operation
- Select desired report
- Configure column visibility
- Review data presentation
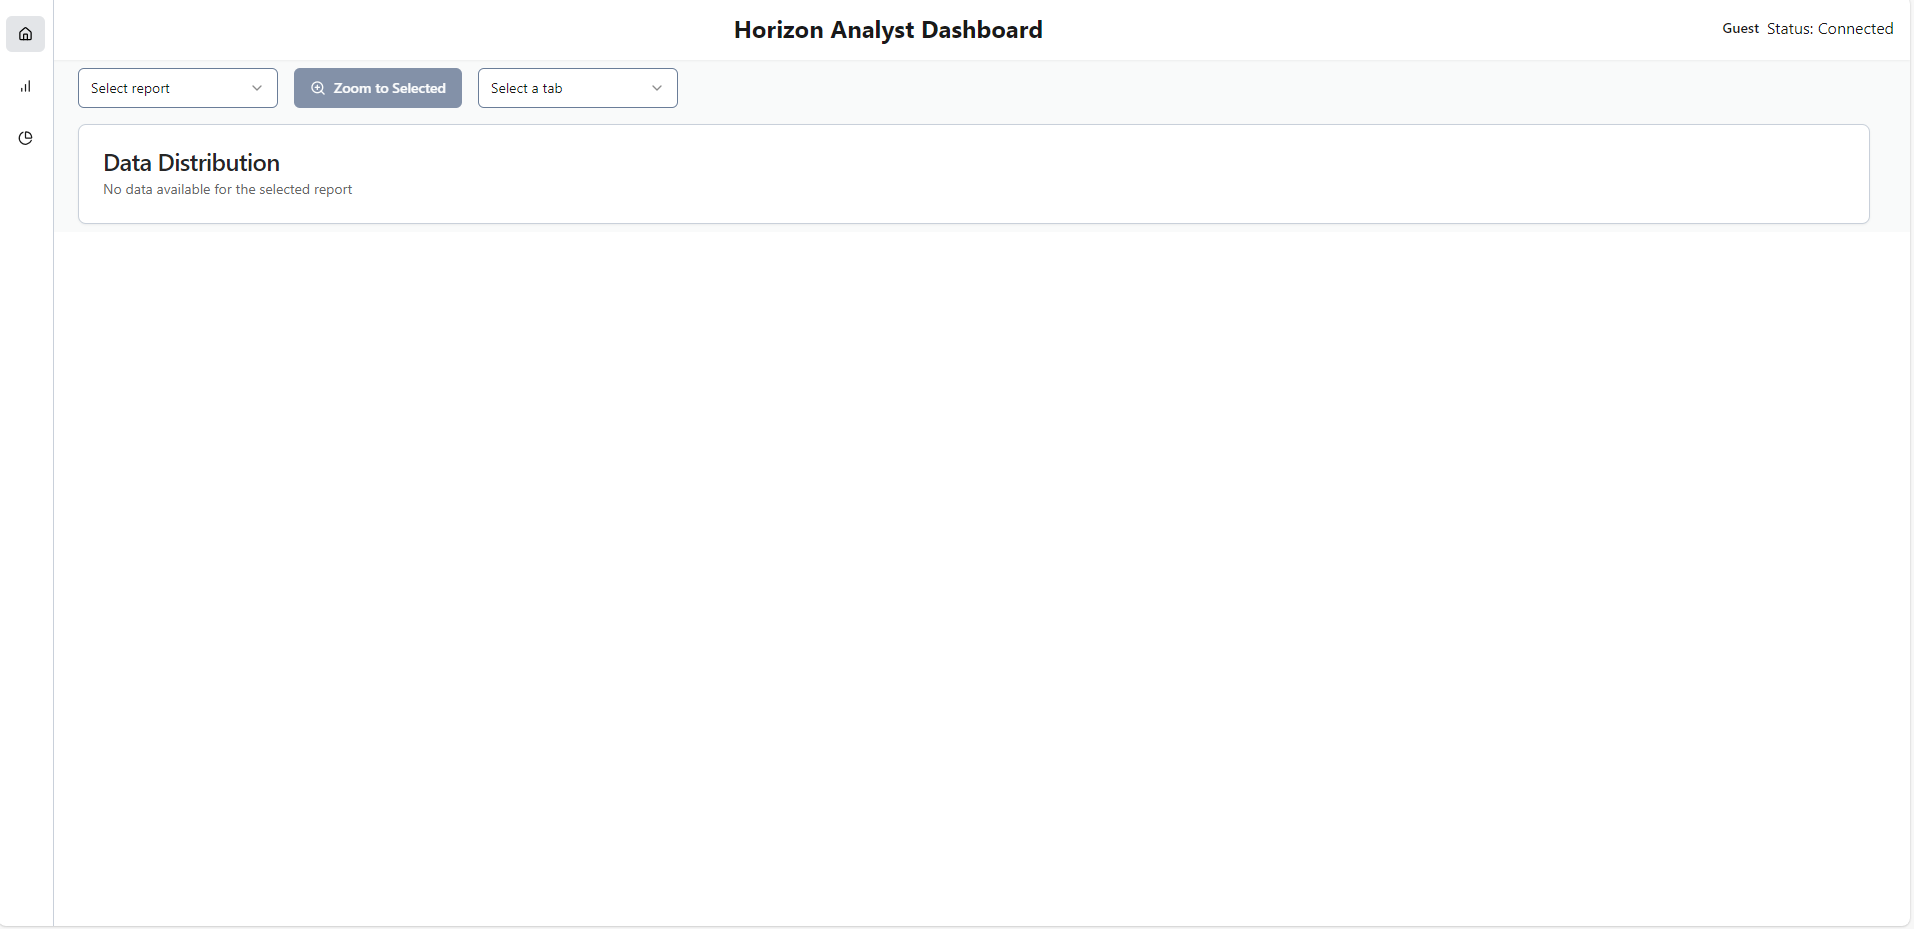
Chart Analysis
- Select analysis attribute
- Review generated charts
- Interact with visualizations
Communication Features
Horizon to Analyst
- Select/draw geometry in Horizon
- Click filter button
- View data in Analyst
Analyst to Horizon
- Select table data
- Use "Zoom to Selected"
- View in Horizon map
Troubleshooting
| Issue | Solution |
|---|---|
| Connection lost | Refresh both windows |
| Chart display issues | Verify attribute selection |
| Performance delays | Reduce selection size |
| Zoom issues | Check data selection |