Appearance
Canopy Analyze Tool
Overview
The Canopy Analyze Tool provides two analyses over a single area you define on the map:
- Analyse — detailed canopy-height statistics (maximum, minimum, average, standard deviation, pixel count) for the area. You choose which service does the work from the Analysis engine dropdown: ArcGIS Image Service (the default) accepts areas up to 250 hectares and returns extra figures — a median, a coverage figure, and a height-distribution breakdown; GeoServer (WPS) is the original engine and is still limited to 0.25 hectares.
- Tree Tops Detection — detects individual trees in the area using the external ForestTools service, reporting tree count, stems per hectare, and mean/tallest height, and drawing the detected treetops (or crown outlines) on the map. Allows much larger areas (up to 500 hectares).
You define the analysis area once, then run either analysis on it.
Key Features
- Flexible Area Definition: Draw custom polygons, use preset shapes (boxes and circles), or select an existing polygon from a map layer
- Preset Shape Tools: Quick-create standard boxes and circles centered on your map view
- Interactive Shape Editing: Resize and reposition analysis areas with transform tools
- Real-Time Area Display: See the current area size while drawing and editing
- Comprehensive Statistics: Get detailed canopy height metrics for your analysis area
- Choice of Analysis Engine: Run Analyse on the ArcGIS Image Service for large areas and extra figures, or on the original GeoServer (WPS) engine as a fallback
- Height Distribution: See how the canopy in your area is split across height bands, in the same colours the map uses
- Individual Tree Top Detection: Detect treetops or crown outlines and get tree counts, density, and height statistics
- Area Validation: Built-in limits per analysis (250 ha or 0.25 ha for Analyse depending on the engine, 500 ha for Tree Tops Detection)
- Precision Results: Statistics include max, min, average, standard deviation, median, pixel count, and area
How to Use the Canopy Analyze Tool
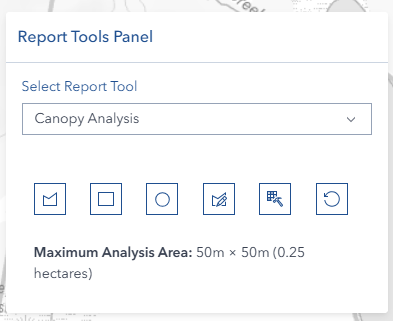
Accessing the Tool
- Navigate to the Report Tools panel in the right sidebar
- Select Canopy Analysis from the report type dropdown
- The tool panel will open showing drawing and analysis options
Choosing an Analysis Engine
The Analysis engine dropdown sits directly above the area readout, because your choice changes how much ground the Analyse button will accept. A one-line description of the selected engine is shown underneath it.
| Engine | Maximum area | What you get |
|---|---|---|
| ArcGIS Image Service (default) | 250 ha | Faster, and returns the most: max, min, average, standard deviation, median, pixel count, area, a Covered (ha) figure, and a Height distribution breakdown |
| GeoServer (WPS) | 0.25 ha | The original engine — max, min, average, standard deviation, pixel count and area only |
Leave the engine on ArcGIS Image Service for normal work; it is the only option that can analyse a whole coupe. Switch to GeoServer (WPS) if the image service is unavailable, or when you need a result produced the same way as your older records.
Changing the engine clears any result already on screen, because the two engines return different figures — click Analyse again after switching. The dropdown is disabled while an analysis is running, and your choice is kept when you click Reset.
Defining Your Analysis Area

The toolbar is arranged in two rows: Draw (draw polygon, create a box, create a circle, edit shape) and Analyse (Analyse, Reset).
You have four ways to create an analysis area:
Option 1: Draw a Custom Polygon
- Click the Draw Polygon button (polygon icon)
- Click points on the map to define your boundary
- Continue clicking to add vertices as needed
- Double-click or click the first vertex to complete the polygon
- The tool exits drawing mode after completion
Best for: Irregular areas, custom boundaries, specific plot shapes
Option 2: Create a Preset Box
- Click the Create a box button (rectangle icon)
- A 50 m × 50 m box appears centered on your current map view — 0.25 ha, which is exactly the maximum the GeoServer (WPS) engine accepts, and far inside the 250 ha the ArcGIS Image Service allows, so a fresh preset box is always within the limit on either engine
- The shape automatically enters edit mode for immediate adjustment
- Resize using corner handles while maintaining aspect ratio
- Reposition by dragging the entire shape
Best for: Square sample plots, standard harvest units, regular grid analysis
Option 3: Create a Preset Circle
- Click the Create a circle button (circle icon)
- A circle of 25 m radius (50 m across, about 0.20 ha) appears centered on your current map view — within the limit on either engine
- The shape automatically enters edit mode for immediate adjustment
- Resize using edge handles while maintaining circular shape
- Reposition by dragging the entire shape
Best for: Circular sample plots, point-centered analysis, radial studies
Option 4: Select an Existing Map Polygon
Instead of drawing, you can use a polygon that is already on the map (for example a coupe or operation boundary). This control lives in the Tree Tops Detection section:
- Expand the Tree Tops Detection block
- Choose a visible polygon layer from the Select dropdown
- Click the Select polygon from layer button (select icon) to arm selection
- Click the polygon on the map — it becomes your analysis area
Only visible polygon layers are listed, so if the layer you want is missing, switch it on in the Layer List first and reopen the dropdown. Layers made up of several sublayers are listed one entry per sublayer. The select button stays disabled until you have chosen a layer, and if you switch that layer off while it is selected, the selection is dropped and the button disarms.
The selected polygon is used by both the Analyse and Detect Tree Tops buttons. Selecting replaces any existing area (one area is analysed at a time).
Best for: Reusing existing boundaries such as coupes, operations, or your own saved polygons
Editing Your Analysis Area

Activate Edit Mode
- Click the Edit Shape button (edit-geometry icon)
- Your shape displays with editing handles
- The button appearance changes to indicate active editing
Editing Tools

For Custom Polygons:
- Use reshape tools to adjust individual vertices
- Move vertices to refine your boundary
- The shape updates in real-time
For Preset Shapes (Boxes and Circles):
- Resize: Drag corner/edge handles to scale the shape (aspect ratio is preserved)
- Move: Click and drag the shape to reposition
- Maintain Shape: Preset shapes preserve their form (boxes stay square, circles stay round)
- Size Limits: Maximum dimension of 500 metres, enforced automatically. This limit applies to preset shapes only — a resize past it is rejected and the shape snaps back. Hand-drawn and layer-selected polygons are not capped this way; they are governed by the area limits below.
Monitor Your Area Size
- Max Analyse area shows the limit for the engine you have selected — 250 ha on the ArcGIS Image Service, or 50m × 50m (0.25 Ha) on GeoServer (WPS). It changes as soon as you switch engines, and it is the limit for the Analyse button only, not for Tree Tops Detection
- Current Area shows live calculations while editing in both hectares (ha) and square meters (m²)
- If the area exceeds the selected engine's limit, a red "Too large for Analyse (max 250 ha)" note appears beside it — or "Too large for Analyse (max 0.25 ha)" on the WPS engine. This does not block tree top detection, which allows up to 500 ha
- Area updates in real-time as you resize or reshape
Exit Edit Mode
- Click the Edit Shape button again to finish editing, OR
- Click elsewhere on the map to exit edit mode
Running the Analysis
- Ensure your analysis area is defined and sized appropriately
- Check the Analysis engine dropdown, and that the area is within that engine's maximum — 250 ha on the ArcGIS Image Service, 0.25 ha on GeoServer (WPS)
- Click the Analyse button (raster analysis icon)
- Wait while the analysis processes (loading indicator appears)
- Results display automatically in the results card
Understanding Your Results
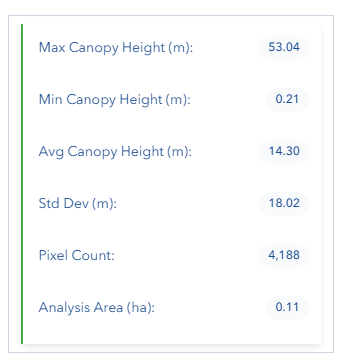
The Canopy Analysis Results card displays comprehensive canopy height statistics as a grid of figures. Which figures appear depends on the engine you ran.
Statistical Measures
- Max (m): The tallest canopy measurement within your area
- Min (m): The shortest canopy measurement within your area
- Avg (m): The mean canopy height across all pixels
- Std dev (m): Standard deviation showing height variability
- Median (m): The middle canopy height — half the canopy is shorter, half taller. Less affected by a few very tall or very short returns than the average, so on an uneven stand the two are worth reading together. ArcGIS Image Service engine only
- Pixels: Number of data points analyzed
- Area (ha): Confirmed area size of your polygon
- Covered (ha): How much of that area actually holds canopy data. The canopy model covers managed forest only, so a polygon that runs over cleared land, water or town encloses more ground than it measures. This figure only appears when it differs from Area (ha) — on a fully forested area the two are the same and it is left off. ArcGIS Image Service engine only
Height Distribution
ArcGIS Image Service engine only. Below the figures, a Height distribution strip shows how the canopy in your area is split across height bands, with the total area covered by the bands shown to its right.
- The strip is always in height order — shortest canopy on the left through tallest on the right — never sorted by size, because the bands are a scale rather than separate categories. The width of each segment is that band's share of the area, except that very small bands are drawn at a minimum width so they stay visible — read the exact figures from the band table below.
- Segment colours are the same canopy colours the map uses, so a band's colour matches what that height already draws as on the canopy height layer.
- Hover a segment to read it out on the line below, as height range, area and share — for example 15–18 m · 3.42 ha · 27.4%. With nothing hovered, the line shows the largest band and says so, so the most useful figure is readable without touching anything.
- Bands with no canopy in them are not drawn at all, so a typical area shows only a handful of segments.
- Click Show band table for the exact area and percentage of every band, each with its colour swatch. The table starts collapsed; click Hide band table to fold it away again.
Detecting Individual Trees
Beyond canopy-height statistics, the tool can detect individual trees in your analysis area using the external ForestTools service. It finds each treetop from the canopy height model — and, optionally, outlines each tree crown — then reports how many trees there are, how densely they are packed, and how tall they are.
Tree Tops Detection allows a larger area than Analyse: up to 500 hectares (shown as Max detection area: 500 ha), compared with 250 ha for Analyse on the ArcGIS Image Service engine, or 0.25 ha on GeoServer (WPS).
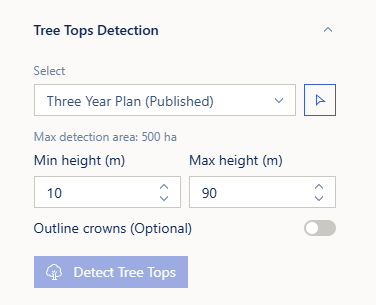
Availability
The Tree Tops Detection section is collapsed by default — click its heading to expand it. If the detection service cannot be reached, a warning notice appears and the Detect Tree Tops button is disabled. When this happens, the height-statistics Analyse button still works normally.
Detection Settings
| Setting | Default | Range | What it does |
|---|---|---|---|
| Min height (m) | 10 | 0–100, in 0.5 steps | Canopy shorter than this is not counted as a tree. Applied before detection, so it changes which trees are found — the main control on the result. |
| Max height (m) | 90 | 0–100, in 0.5 steps | Drops trees taller than this from the result. Applied after detection, so the trees it keeps are unchanged. Clear the field (No limit) to remove the ceiling entirely. |
| Outline crowns | Off | — | Returns crown polygons in addition to treetop points. Slower, and a much larger result. |
Max height is pre-filled, not blank
The Max height field starts at 90 m, so by default any tree detected above 90 m is dropped from the result. This is a deliberate guard against implausible returns — Tasmanian Eucalyptus regnans reaches roughly 100 m — but if you are working in tall old-growth and your counts look low, clear the Max height field to run with no upper limit.
Max height must always be above Min height. If you raise the minimum past the pre-filled ceiling you will get an "Invalid Height Range" warning; lower the minimum, raise the maximum, or clear the maximum.
Running Tree Tops Detection
- Define your analysis area (draw, preset, edit, or select from a layer)
- Expand the Tree Tops Detection section
- Set Min height (m) — see the settings table above
- (Optional) Adjust or clear Max height (m)
- (Optional) Turn on Outline crowns to also return crown polygons. This is slower and produces a much larger result
- Click Detect Tree Tops
While detection runs, a progress bar and an elapsed-time counter show its status: Submitting, Queued, Detecting tree tops, Downloading results, Drawing N of M trees, and finally Adding trees to the map. Click Cancel at any time to stop.
Small areas are answered immediately. Anything larger is submitted to a shared job queue on the service, so you may see "Queued (2 ahead)" — that means other people's detections are running first. A large coupe can take a few minutes. If a job runs for more than 20 minutes the app stops waiting and tells you it "may still be running on the server"; the work is not lost, but you will need to run it again or ask an administrator to check the service.
When it finishes, the detected trees are added to the map:
- Treetops are drawn as points coloured by tree height (shorter trees blue, taller trees red), and grouped into clusters when you zoom out. Zoom in past about 1:5,000 and individual trees reappear.
- Crown outlines (if you turned on Outline crowns) are drawn as polygons, with the treetops on top.
- Click any tree to see its height in a popup.
- The Legend gains a "Tree height (m)" entry showing the colour scale used for this run.
The Detected-Tree Layer
The result is added to the map as a real layer, so it appears in the Layer List and can be switched off, zoomed to, or removed there as well as by Reset:
- Treetops only → a layer named Detected Tree Tops (count)
- With Outline crowns on → a group named Detected Tree Tops & Crowns (count), containing Tree Crowns and Tree Tops
Understanding Tree Tops Detection Results
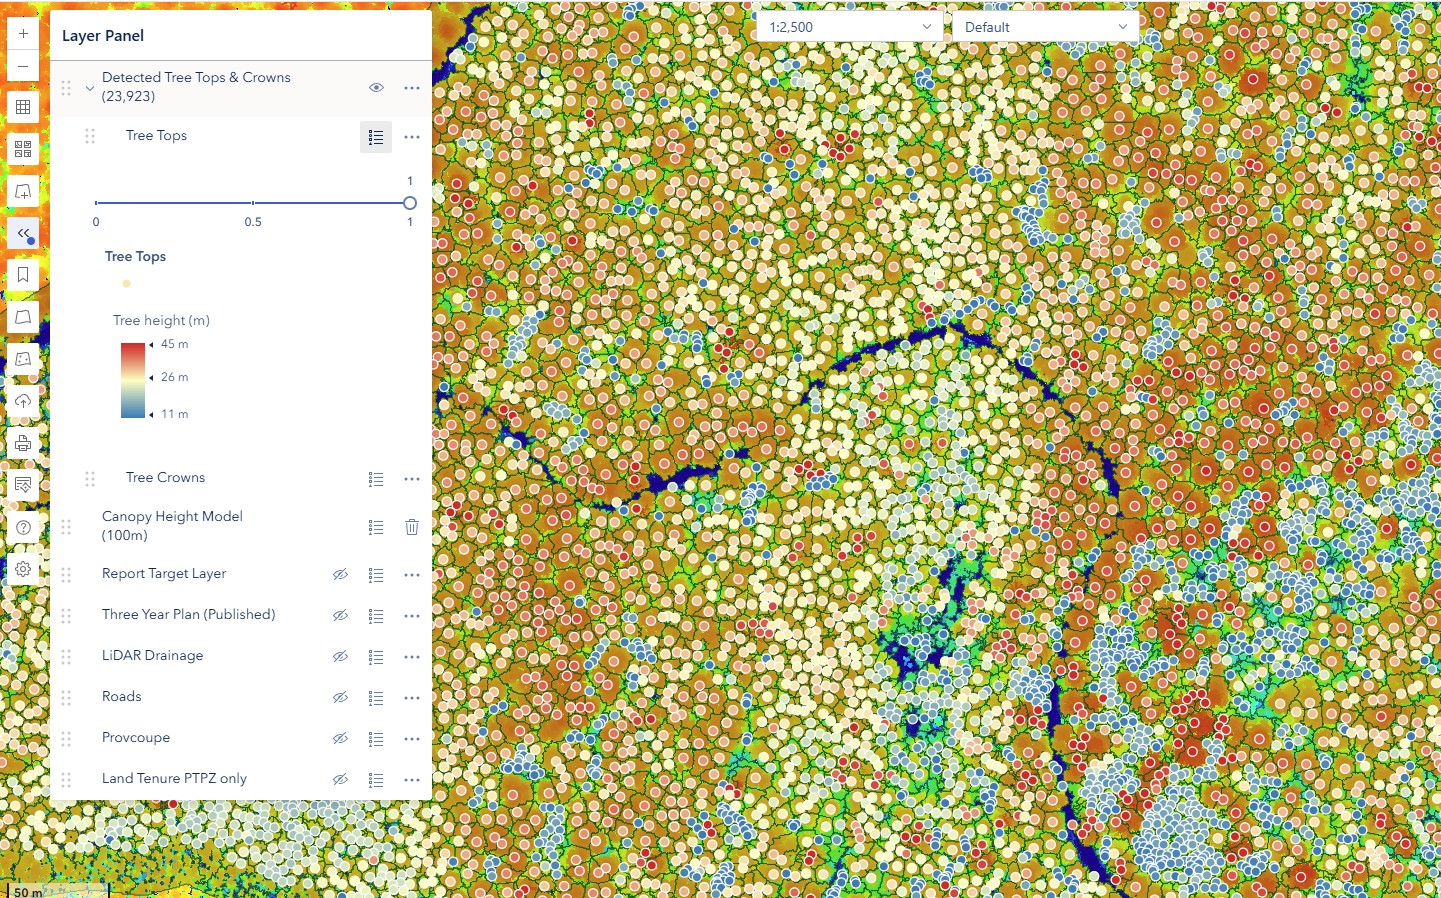
The Tree Tops Detection Results panel shows:
- Tree tops detected: The number of trees found
- Stems per hectare: Tree density, calculated as the tree count divided by the whole analysis area you drew — including any clearings, roads or water inside it. On a partly non-forested polygon this reads lower than the density of the stocked portion
- Mean height (m): Average detected tree height
- Tallest tree (m): The height of the tallest detected tree
The detected-tree layer stays on the map when you switch to another report tool or close and reopen the panel. Running a new detection replaces the previous result, and Reset clears it.
Resetting and Starting Over
Click the Reset button (reset icon) to:
- Clear your analysis area from the map
- Remove all result displays, including detected trees
- Restore the tree-detection settings to their defaults (Min height 10 m, Max height 90 m, Outline crowns off)
- Return to a fresh state for new analysis
- Deactivate any active drawing or editing modes
Reset does not change your Analysis engine choice — that stays as you set it.
Video Tutorials
Get area to Analyst
Tree Tops Detection
Troubleshooting
| Issue | Solution |
|---|---|
| Analyse button not responding | Verify area is drawn and within the selected engine's limit — 250 ha on the ArcGIS Image Service, 0.25 ha on GeoServer (WPS) |
| "No geometry" error message | Draw or select an analysis area first |
| "Area Too Large" warning | The area is over the selected engine's limit. Reduce it, divide it into sections, or switch the Analysis engine to ArcGIS Image Service, which allows 250 ha instead of 0.25 ha |
| "No Canopy Data" message | Nothing has gone wrong — the canopy model covers managed forest only, so an area over water, town, cleared land or unmapped country holds no data to measure. Move or reshape the area so it overlaps forested ground |
| "Analysis Failed" — refused as too large even though my area is under 250 ha | The service limits the image by width and height, not by total area, so a long thin strip can be refused while a compact area of the same size is accepted. Split it into more compact parts, or draw a less elongated shape |
| Edit mode won't activate | Ensure an analysis area exists on the map |
| Preset shape doesn't appear | Check map is zoomed to appropriate scale |
| Can't resize preset shape | Verify edit mode is active (button highlighted) |
| Size limit exceeded warning | A preset box or circle was resized past 500 m in one dimension — make it smaller. Hand-drawn shapes are not affected |
| No results displayed | Confirm the analysis area falls inside the canopy-height data coverage. The analysis reads the canopy model on the server, so it does not require the layer to be switched on in your map |
| Results seem incorrect | Verify analysis area is within data coverage zone |
| Shape disappears after editing | Click elsewhere on map or toggle edit button to complete |
| Analysis takes too long | Reduce area size; larger areas require more processing |
| Can't create new shape | Click Reset to clear existing analysis first |
| My layer is missing from the Select dropdown | Only visible polygon layers are listed — switch the layer on in the Layer List, then reopen the dropdown |
| Detect Tree Tops button is disabled | Three causes: no analysis area is defined, a detection is already running, or the service is unreachable (a warning notice shows). Note the button is inside the collapsed Tree Tops Detection block — expand it to see the button at all |
| "Tree Tops Detection Unavailable" / service-not-reachable notice | The detection service is down or unreachable — the Analyse button still works; contact your administrator if it persists |
| "Area Too Large For Detection" | Reduce the area below the 500-hectare detection limit, or split it into parts |
| Detection refused as too large even though my area is under 500 ha | The service measures the bounding box around your shape, not its drawn area. A long diagonal or L-shaped area has a box several times larger. Split it into more compact parts |
| "Invalid Height Range" warning | Set Max height above Min height, or clear Max height for no upper limit |
| "No Trees Detected" | Lower the Min height, or confirm the area actually contains canopy |
| Fewer trees than expected in tall forest | Max height is pre-filled at 90 m and drops anything above it — clear the field to run with no upper limit |
| Detection takes minutes | Large areas run as a background job on a shared queue; watch the progress and elapsed time, or click Cancel |
| "Stopped waiting for job…" | The job passed the 20-minute client limit. It may still be finishing on the server — try a smaller area, or ask an administrator to check the service |
Frequently Asked Questions
Q: How accurate are the canopy height measurements? A: The canopy height data comes from high-resolution LiDAR with 50cm × 50cm per pixel resolution, providing very precise measurements suitable for detailed forest analysis.
Q: Can I analyze multiple areas at once? A: No, analyze one area at a time. Use the Reset button between analyzes and document your results before moving to the next area.
Q: Why do preset shapes enter edit mode automatically? A: This allows you to immediately position and size the shape exactly where you need it, making the workflow faster and more efficient.
Q: What does "Pixels" mean in the results? A: Each pixel represents a 50cm × 50cm area on the ground. The pixel count shows how many data points were analyzed, indicating the detail level of your results.
Q: How should I interpret Standard Deviation? A: Standard deviation shows canopy height variability. Low values (0-5m) suggest uniform, even-aged forest. High values (10-20m) indicate mixed-age or structurally complex forest.
Q: Can I save my analysis results? A: Currently, results are displayed only during the session. Take screenshots or manually record statistics for documentation purposes.
Q: Which analysis engine should I use? A: ArcGIS Image Service for almost everything — it is the default, it accepts areas up to 250 ha, and it returns the median, the coverage figure and the height distribution as well as the standard statistics. Use GeoServer (WPS) when the image service is unavailable, or when you need a result produced the same way as your older records; it is limited to 0.25 ha.
Q: What happens if I click Analyse with an area over the limit? A: The system will prevent the analysis and display an "Area Too Large" message showing your current area size and the maximum allowed for the engine you have selected — 250 ha on the ArcGIS Image Service, or 0.25 ha (50m × 50m) on GeoServer (WPS).
Q: Why did my result disappear when I changed the engine? A: The two engines return different figures — only the ArcGIS Image Service produces a median, a coverage figure and a height distribution — so a result from one engine would be misleading under the other engine's settings. The card is cleared on the switch; click Analyse again to run on the new engine.
Q: Why is "Covered (ha)" smaller than "Area (ha)"? A: The canopy model covers managed forest only. Area (ha) is the polygon you drew; Covered (ha) is how much of it actually holds canopy data. If your area runs over cleared land, water or town, the second figure is lower — and all the statistics describe the covered part only. When the two match, the Covered figure is not shown at all.
Q: Why does the area display show different values while editing? A: The area calculation updates in real-time as you resize or reshape your analysis area, giving you immediate feedback on the size.
Q: What is the difference between Analyse and Tree Tops Detection? A: Analyse returns canopy-height statistics (max, min, average, etc.) for the whole area and is limited to 250 ha on the ArcGIS Image Service engine, or 0.25 ha on GeoServer (WPS). Tree Tops Detection finds individual trees, reporting counts, density, and height, and allows up to 500 ha. They share the same analysis area, so you can run either on the polygon you have defined.
Q: Why is Max height already filled in at 90 m? A: It is a guard against implausible returns from the canopy model. Tasmanian Eucalyptus regnans reaches roughly 100 m, so a 90 m ceiling excludes obvious artefacts without touching normal trees. If you are working in very tall forest, clear the field to run with no upper limit.
Q: Should I use treetops or crown outlines? A: Treetops (the default) are faster and produce a much smaller result — best for counting trees and seeing their distribution. Turn on Outline crowns when you need each tree's crown shape and area; it is slower and larger.
Q: What do the tree colours mean? A: Detected treetops are coloured by height — shorter trees toward blue and taller trees toward red. The colour scale is fitted to the trees actually found in each run, so both young regrowth and tall stands use the full range. The current scale is shown in the map Legend as "Tree height (m)".
Q: Why can I detect trees over a larger area than I can Analyse? A: The two run on different services with different limits. Tree Tops Detection allows up to 500 ha, running longer requests as a background job. Analyse allows 250 ha on the ArcGIS Image Service engine — and only 0.25 ha on the older GeoServer (WPS) engine, which reads every pixel inline. If Analyse is refusing an area you can detect trees over, check that the Analysis engine is set to ArcGIS Image Service.
Q: Why was my detection refused when the area is under 500 ha? A: The 500 ha check is on the area you drew, but the detection service measures the bounding box around your shape. An L-shaped or long diagonal area can have a box several times its drawn area, so the service can still refuse it. Split the area into more compact parts and run them separately.
Q: Do my detected trees disappear when I switch tools? A: No. The detected-tree layer stays on the map when you switch report tools or reopen the panel, and it appears in the Layer List where you can switch it off. It is replaced when you run a new detection, and cleared by Reset.