Appearance
Imagery Tool
Overview
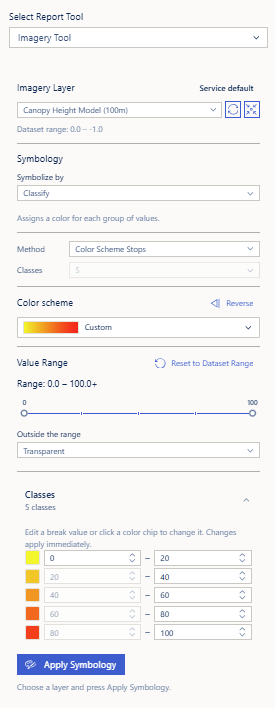
The Imagery Tool changes how an imagery layer (an image service such as the Canopy Height Model or a slope raster) is drawn on the map. Instead of accepting the service's default rendering, you choose how values are turned into colour: a smooth stretch, classified bands, a shaded-relief surface, and so on — then apply it to the live map.
It works on imagery layers that are already on the map. Add one from the Layer Catalog first; if none is present the tool says so and offers a Refresh to re-scan the map.
This is display only
The tool changes how the raster is drawn. It never modifies the published service, and it does not change the layer's opacity — that stays with the layer list.
Key Features
- Five rendering types: Stretch, Discrete, Classify, Unique Values and Shaded Relief
- Colour scheme picker: in-house schemes that match the published GeoServer styles, plus the full set of ArcGIS raster colour ramps, with a search box and a Featured group
- Editable class table: adjust any class break or colour and see the map update immediately
- Value range filter: restrict the display to part of the raster's range, with the values outside it either hidden or clamped to the end colours
- Custom colour schemes: edit a copy of any scheme, stop by stop, and keep it for later
- Legend integration: the applied symbology (and its labels) appears in the Legend
- Carried into bookmarks and printing: a styled layer keeps its symbology when you save a bookmark or print the map
- Restore Default: put the layer back to its original service rendering at any time
How to Use the Imagery Tool
Accessing the Tool
- Navigate to the Report Tools panel in the right sidebar
- Select Imagery Tool from the report tools dropdown
Choosing a Layer
The Imagery Layer section lists every imagery layer on the map. Layers that are currently switched off are marked (hidden) so you can tell why nothing changes on screen.
- Refresh re-scans the map after you add a layer
- Zoom moves the map to the selected layer's extent
- A chip beside the section title reads Service default or Custom symbology, so you always know whether what you are looking at is the tool's work or the service's
Choosing a Rendering Type
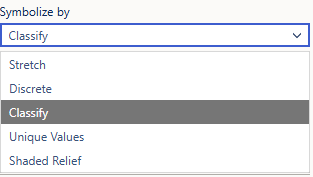
Symbolize by offers the same five choices as ArcGIS Pro:
| Type | What it does | Best for |
|---|---|---|
| Stretch | Spreads a colour ramp smoothly across the value range | Continuous surfaces — canopy height, elevation |
| Discrete | Groups the data into a set number of colours | A banded look without editing breaks |
| Classify (default) | Assigns a colour to each group of values, with an editable break table | Reporting bands such as height or slope classes |
| Unique Values | Assigns a colour to each distinct value | Coded rasters — land classes, masks |
| Shaded Relief | Draws a 3-D shaded surface using a sun position | Elevation and terrain models |
Each type shows only the settings that apply to it:
- Classify / Discrete — Method (how breaks are calculated) and Classes (how many)
- Stretch — Stretch type (Minimum Maximum, Standard Deviation, Percent Clip, Histogram Equalize, Sigmoid, None), optional gamma, and Adjust to display extent, which re-stretches as you pan and zoom
- Shaded Relief — Hillshade type (Traditional or Multi-directional), Scaling, Sun azimuth, Sun altitude and Z factor
Unique Values on a continuous raster
A continuous raster has no small set of distinct values, so the tool says so and suggests Classify or Discrete instead.
Classification Methods
| Method | How breaks are chosen |
|---|---|
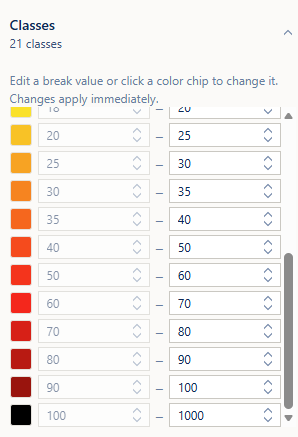
| Color Scheme Stops (default) | Uses the colour scheme's own stop values, which reproduces a published style faithfully — the canopy scheme's 21 stops become 21 fine bands rather than a few wide ones |
| Natural Breaks (Jenks) | Groups values where the data naturally clusters |
| Equal Interval | Bands of equal width |
| Quantile | Bands holding an equal number of pixels |
| Standard Deviation | Bands measured from the mean |
| Defined Interval | Bands of a size you enter |
| Manual | Keeps whatever breaks are in the table so you can type your own |
When a service publishes no statistics
Ranges and classes are pre-filled from the service's own statistics and histogram. If a service publishes none, the tool says so — ranges cannot be pre-filled, and Natural Breaks and Quantile fall back to equal-width classes.
Colour Schemes
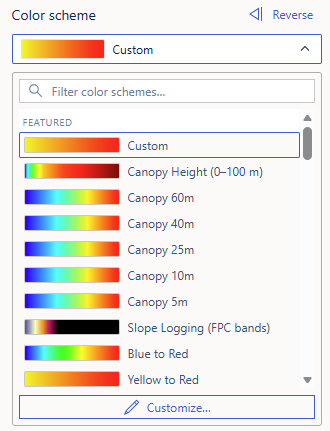
The Color scheme picker lists schemes in two groups: Featured first, then All color schemes. Type in the box to filter by name, and use Reverse to flip any scheme.
Featured schemes include the in-house styles that match what the map already draws elsewhere:
| Scheme | Notes |
|---|---|
| Canopy Height (0–100 m) | The default. Matches the published canopy height model style |
| Canopy 60m / 40m / 25m / 10m / 5m | The same reading over a lower ceiling, so the whole ramp is spent on the heights a canopy model actually reaches |
| Slope Logging (FPC bands) | Slope in degrees, in the same five Forest Practices Code bands the Slope Classification Tool reports (≤11°, 11–19°, 19–26°, 26–35°, >35°) |
The rest of the list is the standard ArcGIS raster ramp set — Blue to Red, Viridis and Magma (both colour-blind safe), Greys, Spectral and so on.
Choosing a lower-ceiling canopy scheme
Narrowing the value range changes only what is visible; it does not re-spread the colours. To give more colour detail to low canopy, pick a scheme with a lower ceiling (for example Canopy 10m) rather than narrowing the range.
Customising a Scheme
Customize… opens Color scheme stops — an editable copy of the current scheme:
- Change any stop's colour or its value
- Add stop inserts another
- Remove a stop with its delete button
- Discard custom scheme goes back to the presets
The copy is named Custom and is kept for later, so you do not have to rebuild it each session.
The Class Table
The Classes block (collapsed by default) lists every class with its Color, Value range and Label.
- Click a colour chip to change that class's colour
- Edit a break value to move the boundary
Changes apply immediately. If a value you type would overlap or invert a neighbouring class it is adjusted to the nearest legal value, and a message explains that breaks must increase down the table.
Colours you pick are remembered against the value they belong to, so changing the class count, method or range does not scramble your choices.
The Value Range
Value Range limits the display to part of the raster. Drag the two handles (or use Reset to Dataset Range to go back to the service's own minimum and maximum). The readout shows the current range, with a trailing + when the upper handle sits at the dataset maximum.
Outside the range decides what happens to the values you excluded:
- Transparent (default) — they are not drawn at all
- Use end colors — they are drawn in the first/last colour of the ramp
INFO
On a Stretch rendering, the range is only applied once you actually narrow it — a full-extent range never hides data.
Applying and Restoring
- Set up the rendering as above
- Click Apply Symbology (it reads Re-apply once a symbology is live)
- Restore Default puts the layer back to its original service rendering
If the layer cannot accept the rendering, a Couldn't Apply Symbology message appears — the most common cause is a service that does not support dynamic rendering.
The applied symbology also appears in the Legend, carrying your class labels, and is included when you print the map or save a bookmark.
Reading Pixel Values
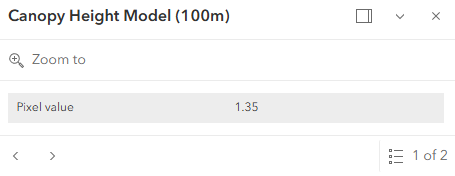
Clicking an imagery layer on the map opens a popup with the pixel value at that point (per band where the raster has several, and reported as "no data" where the raster is masked). This works whether or not you have applied a symbology, and it always reports the underlying value — not the class number it is being drawn as.
Troubleshooting
| Issue | Solution |
|---|---|
| "No Imagery Layers on the Map" | The tool styles a service already on the map — add one from the Layer Catalog, then press Refresh |
| Nothing changes on the map after Apply | Check the layer is switched on — layers listed with (hidden) are off |
| "Couldn't Apply Symbology" | The service may not support dynamic rendering; try Restore Default and a simpler rendering type |
| Ranges and classes are empty | The service publishes no band statistics, so nothing can be pre-filled — enter breaks manually |
| Natural Breaks and Quantile look like equal bands | The service publishes no histogram, so they fall back to equal-width classes |
| Unique Values reports the raster is continuous | Use Classify or Discrete instead |
| Most of the raster disappeared | The Value Range is narrowed with Outside the range set to Transparent — reset the range or switch to Use end colors |
| A break value I typed changed itself | Class breaks must increase down the table; the value was clamped to the nearest legal one |
| Low canopy detail is hard to see | Choose a lower-ceiling scheme (for example Canopy 10m) rather than narrowing the range |
| Custom colours reverted | Discard custom scheme also releases the colours you hand-picked for that scheme |
See Also
- Slope Classification Tool — reports the same Forest Practices Code slope bands the Slope Logging scheme draws
- Canopy Analyze Tool — canopy height statistics and height-distribution breakdown
- Canopy Height Model Filter — filtering the WMS canopy layer by height band
- Legend Panel — where the applied symbology is described