Appearance
Observer Points Editor
Overview
The Observer Points Editor generates spatially distributed observation points within selected polygon boundaries for viewshed and visibility analysis. It supports both manual point placement and automatic grid-based generation, with server-side persistence so a set of points can be saved, reused, and analysed later.
Each saved set is identified by a unique visibility number. Those saved sets feed directly into the embedded Visibility Surface Analysis tool, which computes how many of a saved set's observers can see each part of the landscape.
Formerly "Viewshed Points Editor"
This panel was previously called the Viewshed Points Editor. It has been renamed to Observer Points Editor to match the terminology used across the visibility tools. The toolbar button and its viewshed icon are unchanged.
Key Features
- Target Polygon Selection: Click polygons from any visible polygon layer (Feature Layer or Map Image Layer)
- Manual Point Placement: Draw reference points directly on the map by clicking
- Automatic Grid Generation: Generate evenly distributed points within selected polygons with configurable point count and rotation angle
- Area-Based Point Limits: Maximum points adjust automatically based on total selected area (10 points under 50 ha, 15 points at 50 ha and above)
- Server Persistence: Save generated points to the database with a unique visibility number
- Delete a Saved Set: Remove a previously saved point set by picking its visibility number from a dropdown
- Embedded Visibility Surface Analysis: Run a multi-observer visibility calculation on a saved set without leaving the panel
- Map Image Layer Support: Select polygons from server-based layers with result cycling through overlapping features
Before You Start
- Ensure at least one polygon layer is visible on the map
- Click the Observer Points Editor button (
viewshedicon) in the toolbar to open the panel

INFO
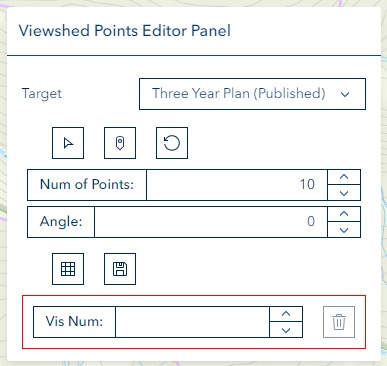
Some screenshots and videos below show the panel's former name, Viewshed Points Editor — the layout and controls are unchanged.
How to Use
Step 1: Select a Target Layer
Choose a visible polygon layer from the Target Layer dropdown. The list includes all Feature Layers with polygon geometry and Map Image Layers with polygon sublayers currently visible on the map.
INFO
If the dropdown is empty, ensure at least one polygon layer is turned on in the Layer Panel.
Step 2: Select Target Polygons
- Click the Select Target Shape button (cursor icon) to activate selection mode
- Click polygons on the map to select them — selected polygons are highlighted
- Click a selected polygon again to deselect it
- The Total (ha) display updates as you add or remove polygons
For Map Image Layer data, clicking the same location cycles through overlapping polygon results. A notification shows which result is selected (e.g., "Selected polygon from LayerName (feature 1 of 3)").
Step 3: Place or Generate Points
You have two options for creating observer points:
Option A — Manual Placement:
- Click the Draw Reference Point button (pin icon) to activate drawing mode
- Click on the map to place individual observation points
- Each point appears as a marker on the map
- Click the draw button again to deactivate drawing mode

Option B — Automatic Generation:
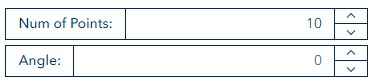
- Set the Point Count value — default is 10, limited by area (see limits below)
- Optionally set a Grid Angle (°) (0–180°) to rotate the point grid
- Click the Generate button
- Any previously generated or manually placed reference points are cleared before the new points are created
- Points are distributed within the selected polygon boundaries using a grid algorithm

INFO
Point limits are based on total selected area: maximum 10 points when total area is under 50 ha, or 15 points when area is 50 ha or above.
Step 4: Save Points
- After placing or generating points, click the Save button
- Points are saved to the server and assigned a unique visibility number
- A success notification displays the assigned number
- The observer points layer refreshes to show the saved data

Resetting
Click the Reset button to:
- Clear all selected polygons from the map
- Remove all placed or generated reference points
- Deactivate selection and drawing modes
- Return to a fresh state
Deleting a Saved Set
To remove a previously saved set of observer points:
- In the delete section (red-bordered area at the bottom of the panel), open the Delete Saved Points (Vis Number) dropdown — it lists all saved visibility numbers, newest first, and defaults to the most recent
- Select the number you want to delete
- Click the Delete button (trash icon)
- Review the confirmation dialog showing the number to be deleted
- Click Delete to confirm or Cancel to abort

TIP
Choosing the number from the dropdown (instead of typing it) avoids mistyping a visibility number and deleting the wrong set. The dropdown refreshes to reflect the latest saved sets.
DANGER
Deleting observer points is permanent and cannot be undone. Always verify the visibility number before confirming.
Video Tutorials
Generating points automatically
Placing points manually
Deleting a saved set
Troubleshooting
| Issue | Solution |
|---|---|
| No layers in dropdown | Ensure at least one polygon layer is visible on the map |
| Cannot select polygons | Click the Select Target Shape button to activate selection mode |
| Generate button produces few points | Reduce the number of points or select a larger polygon area |
| Save fails | Ensure at least one reference point is placed before saving |
| No numbers in the Delete dropdown | You have no saved sets yet; save points first, then reopen the dropdown |
| Delete fails | Verify the visibility number still exists and try again |
| Map Image Layer polygons not working | Verify the layer has visible polygon sublayers |
| Points exceed limit | Only the first 15 points are saved; reduce point count |
Visibility Surface Analysis
The Visibility Surface Analysis tool answers the question "how many observers can see each spot on the ground?" For every cell inside an extent rectangle you draw, it computes how many of a saved observer set can see that cell — the cell's frequency — and draws the result as a colour-graded polygon layer.
Unlike the Line of Sight tool (a single observer), this tool works with a whole saved set of observer points at once — the sets you create and save above. It lives inside this editor as a collapsible block near the bottom of the panel:
- Expand the block to activate the tool and load your saved observer sets. The block starts collapsed every time you open the editor, so you always expand it to begin
- Collapse the block (or close this editor) to deactivate it and cancel any running job — a completed result stays on the map
- After you save or delete a set here in the editor, the tool's observer-set dropdown refreshes automatically — provided the block is expanded at the time. If it's collapsed, the list refreshes when you next expand it
The calculation runs as an asynchronous geoprocessing (GP) job on the ArcGIS Server using a digital elevation model (DEM), so you can keep working while it processes.
Coordinate System
Observer points and the drawn extent are analysed in EPSG:28355 (GDA94 / MGA Zone 55), in metres. Horizon projects your saved points and the drawn box into this system for you automatically, so measurements are accurate regardless of the basemap projection.
Key Features
- Multi-observer visibility — a per-cell observer count, not yes/no visibility from a single point
- Saved observer sets — pick a set by its visibility number, the same sets you save above
- Draw-to-bound extent — the radius is derived from the box you draw; there is no radius to set by hand
- Adjustable parameters — observer height and cell size, plus optional refraction and vertical-error settings
- Colour-graded result with a Legend entry — a real map layer, so each observer-count class gets its own swatch
- Asynchronous processing — watch the status and messages while it runs, or cancel it
- Extent validation — the tool refuses to submit a box that contains none of the selected set's observers
- Target graphics style — observer markers and the extent rectangle follow your customisable Target style
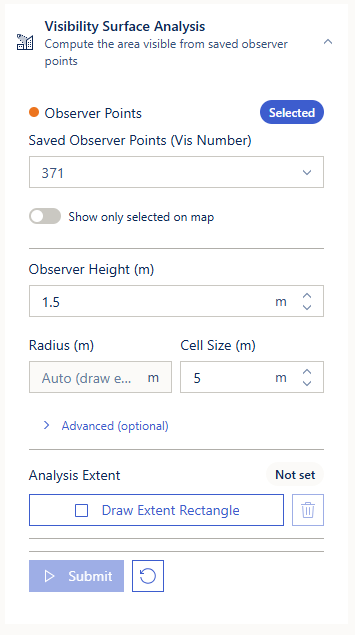
Each control above maps to a step below: pick the observer set, set height and cell size, draw the extent (which fills in Radius), then Submit.
Using the Tool
Step 1: Choose a Saved Observer Set
- Open the Saved Observer Points (Vis Number) dropdown — it lists your saved observer sets, newest first (click the dropdown to refresh the list)
- Select the set you want to analyse
A status chip beside the Observer Points heading tracks this step: it reads Not set until you choose a set, then switches to Selected. If you have no saved sets yet, the dropdown shows "No saved observer points found".
Optionally, turn on Show only selected on map to filter the visibility-points layer so only the chosen set's points are displayed — useful for confirming you picked the right set before drawing an extent. The toggle stays disabled until a set is selected, and the filter is cleared automatically when you collapse the block or close the editor, so the layer is never left filtered behind you.
INFO
The observer points themselves are only fetched when you Submit. Selecting a set just tells the tool which points to use — it does not draw or move anything on its own.
Step 2: Set the Analysis Parameters
| Parameter | Default | Range | Description |
|---|---|---|---|
| Observer Height (m) | 1.5 | 0–500 | Eye height above the ground at each observer point (1.5 m ≈ standing eye level) |
| Cell Size (m) | 5 | 1–50 | The analysis detail. A smaller value gives finer detail but takes longer; a larger value is faster but coarser |
| Radius (m) | Auto | 50–20,000 | Read-only — shows "Auto (draw extent)" until you draw an extent, then fills in automatically from the box (see Step 3) |
Advanced parameters (optional — expand the Advanced row):
| Parameter | Default | Range | Description |
|---|---|---|---|
| Refractivity Coefficient | 0.13 | 0–1 | Atmospheric refraction adjustment |
| Vertical Error (m) | 0 | 0–1,000 | Allowance for vertical error (RMSE) in the elevation model |
Choosing a Cell Size
The default 5 m is a good balance of detail and speed. Lower it (toward 1–2 m) only when you need very fine detail, and raise it for a faster, coarser result over a large area. Run time scales with the extent size, the cell size, and the number of observers — a very large extent or a very small cell size takes noticeably longer.
Step 3: Draw the Analysis Extent
The extent rectangle bounds the area analysed and sets the radius automatically:
- Click Draw Extent Rectangle (square icon)
- A hint appears: "Click and drag on the map to draw the analysis rectangle."
- Click and drag on the map to draw the box around the area of interest
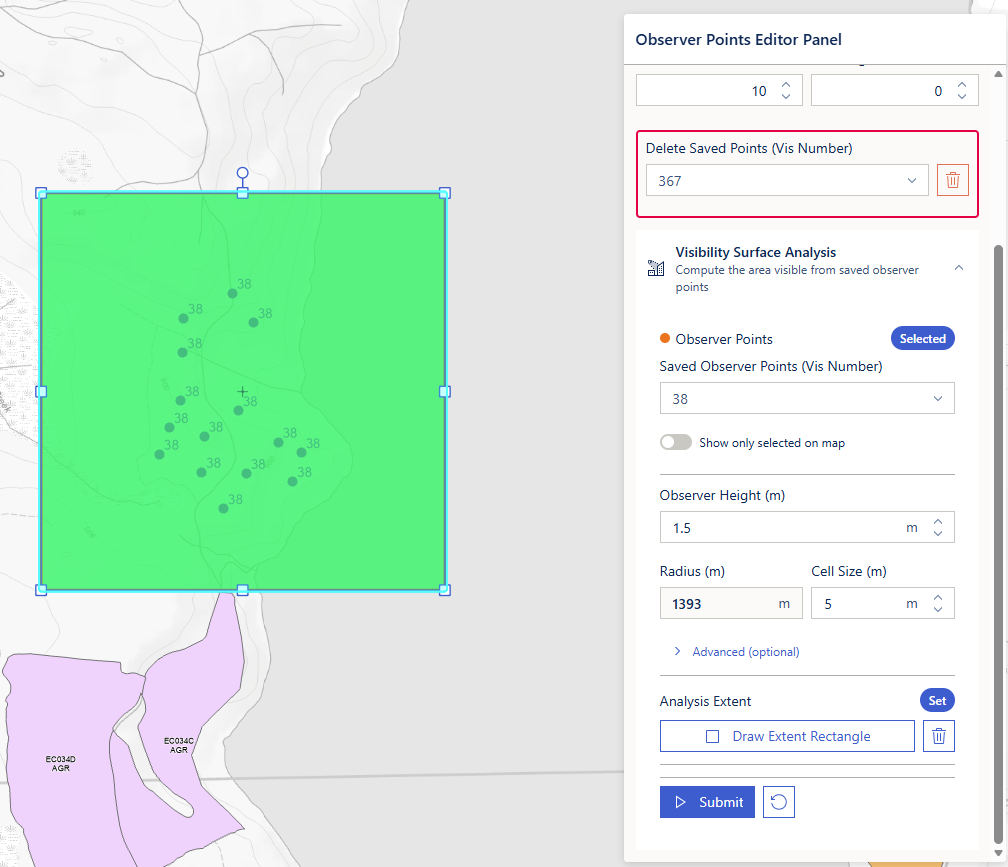
- The Radius field fills in automatically — half the box's diagonal, in true metres, which guarantees the analysis reaches every corner of the box. That is why there is no radius to set by hand
A status chip beside Analysis Extent shows Set once a rectangle is drawn. Click Clear (trash icon) to remove the extent and start again, or click Draw Extent Rectangle again to redraw.
TIP
Draw the extent over the observer set you selected. If the box doesn't overlap any of the chosen set's points, the tool will stop you at Submit (see below) — the result would otherwise be blank.
Step 4: Submit the Analysis
- Make sure an observer set is selected and an extent is drawn — the Submit button enables when both are set and a valid radius has been derived
- Click Submit (play icon)
- The button shows a loading indicator while the job processes
- Real-time status messages appear below the action buttons
Why is Submit greyed out?
Hover the disabled Submit button — its tooltip names the exact missing piece: "Select a saved observer-point set first", "Draw an extent rectangle on the map first", "Select observer points and draw an extent rectangle first", or "Computing radius from the extent…" (a brief wait while the radius is derived from a freshly drawn box).
"No Observers In Extent"
Before submitting, the tool checks that at least one point from the selected observer set falls inside your drawn extent. If none do (for example, you selected vis 366 but drew the box over vis 245's points), it shows a "No Observers In Extent" message and does not submit — saving you a wasted server round-trip that would return an empty surface. Redraw the extent over the correct set, or reselect the set that matches your box.
Monitoring job progress — while the job is running:
- A progress indicator shows the current status with friendly labels — "Submitting…", "Submitted", "Waiting", "Processing", "Completed", "Failed", "Cancelling", "Cancelled", or "Timed out"
- The latest server message is displayed inline
- A message count badge appears once there is more than one message — click it to open the full Job Messages dialog
- A Cancel button appears to abort the job if needed
Job Messages dialog — click the message count badge to open it:
- Draggable and resizable — position it anywhere on screen
- Non-modal — you can keep interacting with the map while viewing messages
- Messages are shown in a numbered, scrollable list with a monospace font
- Error messages are highlighted in red
- Auto-scrolls to the latest message as they arrive
- The heading reflects the job state (Processing, Completed, or Failed)
The dialog can also be opened after the job completes to review the full processing log.
Understanding Your Results
When the job completes successfully, the visibility surface is added to the map as a layer named "Visibility Surface Result" (inside a "Visibility Surface" group), and the map zooms to it. The polygons are coloured by frequency — the number of observers that can see each area:
- Light lavender → seen by a small number of observers (e.g. 1)
- Deeper blue → seen by progressively more observers
- Transparent (no fill) → not visible to any observer — these areas have no legend entry
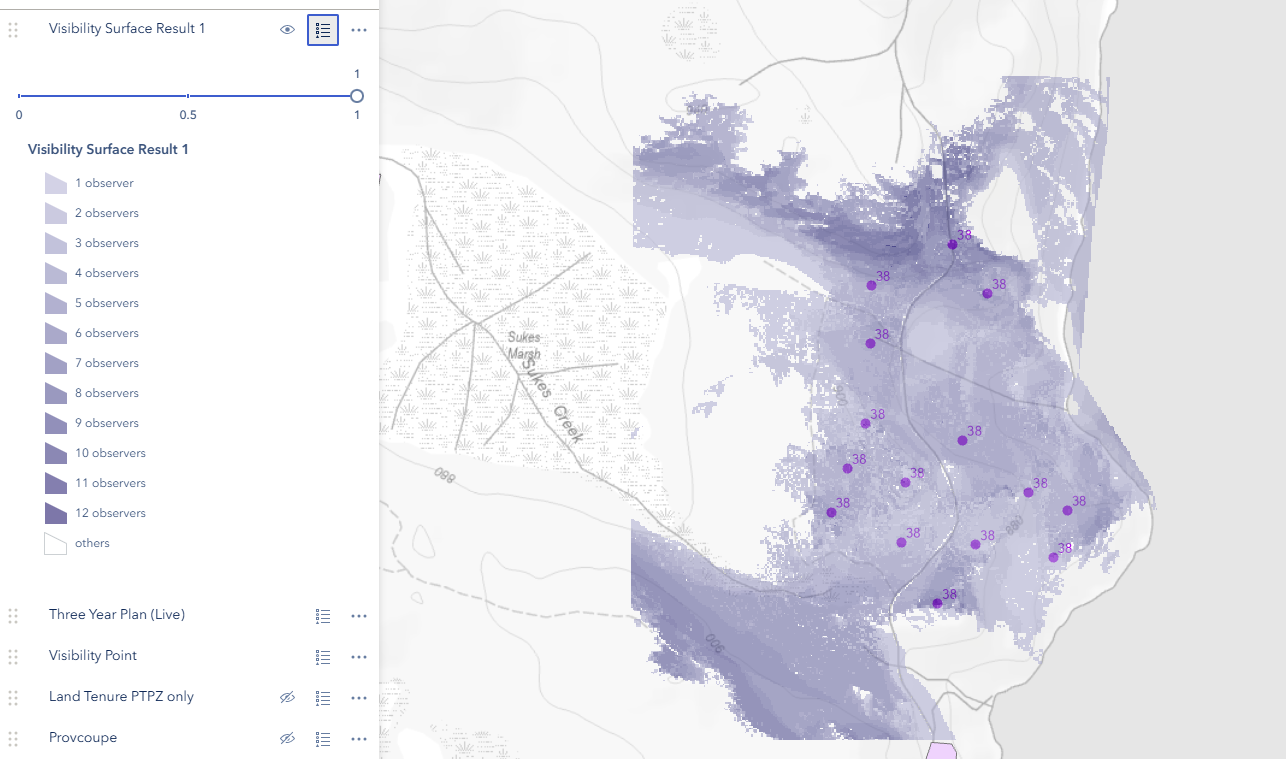
Because the result is a proper map layer (not just drawn graphics), it appears in the Legend with a swatch per class — "1 observer", "2 observers", and so on, up to the maximum overlap — so you can read exactly what each colour means. Areas visible to no observer are left transparent and do not appear in the legend. In the Layer Panel you can toggle the result on/off and adjust its opacity with the slider.
Click any polygon in the result to open a popup showing its Observers value — the exact count for that patch, which is handy when two neighbouring colour classes are hard to tell apart by eye. The colour ramp covers up to 15 observers.
Below the action buttons, a result summary notice reports what was actually rendered — the polygon count, the attribute the observer count was read from, the classes present, and the spatial reference (for example, 1,240 polygon(s) · field "frequency" · classes {0:310, 1:520, 2:410} · SR 28355). It is a quick confirmation that the surface drew as expected; if a run comes back blank, this line is the first place to look (see Troubleshooting below).
Result stays on the map — but re-running replaces it
While the block stays open, re-running the analysis replaces the current result — the previous surface is removed from the map before the new job starts. Only one live result exists at a time.
A result is kept when you collapse the block or close the Observer Points Editor. At that point it is moved out of the Visibility Surface group and renamed with a number ("Visibility Surface Result 1", "Visibility Surface Result 2", …) so successive kept results don't collide. Kept results stay on the map until you remove them from the Layer Panel.
So to compare two runs side by side, collapse the block between them — otherwise the second run overwrites the first.
Customising the Marker Colours
The observer markers and the extent rectangle both use your Target graphics style, editable in System → Graphics Styles (new colours apply the next time you run the analysis). The visibility-surface polygons use a fixed frequency colour ramp so the legend stays consistent.
Resetting the Tool
Click the block's Reset button to clear the observer markers and drawn extent, restore the height, cell size, and advanced parameters to their defaults, remove the current visibility-surface result, and clear the job status and messages.
Visibility Surface Analysis — Video Tutorial
Watch this guide on running a Visibility Surface Analysis:
Visibility Surface Analysis — Troubleshooting
| Issue | Solution |
|---|---|
| The tool controls are greyed out / nothing loads | Make sure the Visibility Surface Analysis block is expanded — it only activates on expand |
| No saved sets in the Vis Number dropdown | You have no saved observer points yet. Save a set above first, then click the dropdown to refresh |
| Submit button is disabled | Hover it — the tooltip names the missing piece (observer set, extent, or a radius still being derived) |
| "No Observers In Extent" message | Your drawn extent doesn't overlap any point in the selected set. Redraw the box over the set's points, or select the set that matches your box |
| Radius stays empty after drawing | Redraw the extent — the radius is derived from the box; if drawing was interrupted, the value may not have been calculated |
| Result is empty or barely visible | The chosen observers may see very little inside the extent. Try a taller observer height, a smaller cell size, or an extent that better covers the terrain of interest |
| Result drew, but everything is transparent | Read the result summary notice — if it says the polygons "drew transparent — observer count not found on field …", the server returned the count under an unexpected attribute name. Report the field list it prints |
| My previous result disappeared | Re-running while the block is open replaces the current result. Collapse the block first to keep a run, then expand and run again |
| Result shows on the map but not in the Legend | Open the Legend panel and confirm the "Visibility Surface" layer is turned on |
| Job fails with an error | Open the Job Messages dialog to read the server error. Common causes are an extent outside the elevation data coverage or a temporary server issue |
| Cannot cancel a job | The Cancel button only appears while a job is actively running |
See Also
- Line of Sight — Single-observer visibility analysis
- Plot Random Tool — Similar polygon selection and point generation for plot sampling
- VR Calculator — Another asynchronous geoprocessing (GP) analysis tool
- Concepts: FeatureLayer vs MapImageLayer — Understanding layer types used for polygon selection