Appearance
Area Summary Tool
Introduction
The Area Summary Tool is an advanced analytical feature in Horizon designed for precise spatial calculations and area analysis. This sophisticated tool enables users to compute areas based on selected attributes within custom-drawn polygons, providing detailed summaries for spatial analysis and planning purposes.
Key Features
- Dual Layer Selection System:
- Geometry Layers: Select polygon layers containing boundary features for analysis areas
- Analysis Layers: Choose target feature layers (including Feature Layers and Map Image Layers) containing data to analyze
- Flexible Geometry Input Methods:
- Select Tool: Choose existing polygon features from visible geometry layers
- Draw Polygon: Create custom polygon boundaries by clicking vertices on the map
- Draw Circle: Click and drag to create a circular analysis boundary
- Draw Rectangle: Click and drag to create a rectangular analysis boundary
- Measure Toggle: Display a live area measurement label (in hectares or square metres) while drawing
- Advanced Spatial Calculation Modes:
- Summary Mode: Individual feature area calculations with detailed attribute breakdowns
- Summary and Union Mode: Combined area analysis with geometry union operations grouped by attributes
- Comprehensive Field Analysis: Calculate areas based on any non-geometry field from the selected analysis layer
- High-Performance Processing: Utilizes advanced layer caching system and ArcGIS geometry operators for optimal performance
- Interactive Results Display: View detailed results in interactive results table with sorting and filtering capabilities
- Smart Layer Management: Automatic layer loading, caching, and cleanup for seamless user experience
How to Use the Area Summary Tool
Accessing the Tool
- Navigate to the right panel in Horizon
- Locate and click the summary area icon

Setting Up Your Analysis
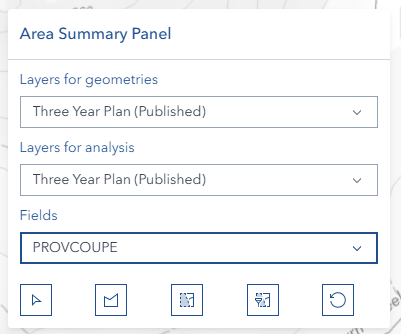
Geometry Layer Selection:
- Choose from "Draw/Select From Layer" dropdown
- Select the layer containing polygon features you want to use as analysis boundaries
- Visible Feature Layers and Map Image Layers with polygon geometries are available
- Click the dropdown to refresh the layer list
Analysis Layer Selection:
- Choose from "Layers for analysis" dropdown
- Select the target layer containing the data you want to analyze
- Only visible feature layers are available for analysis
- The selected layer must have field attributes for meaningful analysis
Field Selection:
- After selecting an analysis layer, choose a field from the "Group By Field" dropdown
- Fields are automatically populated based on the selected analysis layer
- All non-geometry field types are available for analysis
- The field alias is displayed for user-friendly identification
Drawing and Selecting Geometries

The toolbar provides four geometry input methods and a measurement toggle:
Select Existing Polygon (Select Button):
- Click the select polygon button (cursor/select icon) to activate selection mode
- Click on any polygon feature from the selected geometry layer
- Only polygon geometries are accepted for area analysis
- The selected polygon will be highlighted and used as the analysis boundary
- For Feature Layers, polygons are retrieved via hit-test; for Map Image Layers, the tool falls back to the ArcGIS Identify service
- Click the button again to deactivate selection mode
Draw Custom Polygon (Draw Button):
- Click the draw shape button (polygon icon) to activate drawing mode
- Click points on the map to define your custom polygon boundary
- Continue clicking to add vertices to your polygon
- The polygon outline appears in real-time as you draw
- Double-click or click the first point to complete the polygon
Draw Circle (Circle Button):
- Click the draw circle button to activate circle drawing mode
- Click and drag on the map to create a circular analysis boundary
- The circle is converted to a polygon geometry for spatial analysis
Draw Rectangle (Rectangle Button):
- Click the draw rectangle button to activate rectangle drawing mode
- Click and drag on the map to create a rectangular analysis boundary
- The rectangle is converted to a polygon geometry for spatial analysis
Measure Toggle

- Enable the Measure toggle switch in the toolbar to display a live area measurement label while drawing
- The label appears at the centroid of the polygon and updates in real-time as you add vertices or resize the shape
- Areas are displayed in hectares (ha) when 1 ha or larger, or square metres (m²) for smaller areas
- The label is automatically removed when drawing completes or the toggle is switched off
Buffer
The Buffer section appears below the drawing toolbar after a geometry has been drawn or selected. Use it to expand a point, line, or polygon geometry by a fixed distance before running the analysis.
This is especially useful when selecting or drawing point or line geometries, which cannot directly intersect polygon analysis layers without first being buffered into a polygon area.
Controls:
| Control | Description |
|---|---|
| Distance input | Enter the buffer distance (must be greater than 0) |
| Unit selector | Choose the unit: Meters, Kilometers, Feet, or Miles |
| Apply button | Applies a geodesic buffer to the current geometry. The buffered polygon replaces the drawn shape on the map. |
INFO
The Apply button is only active when a geometry is present on the map and the distance is greater than zero. The note beneath the controls reads: "Lines and points must be buffered before filtering."
Calculation Methods

Summary Calculation (Summary Button):
- Click the 'Summary' button (selection icon) for individual area analysis
- Performs intersection analysis between the boundary polygon and analysis layer features
- Each intersecting feature is calculated separately
- Results show individual features with their calculated areas in hectares
- Creates a temporary feature layer with detailed results
- Displays results in an interactive Feature Table

Summary and Union Calculation (Union Button):
- Click the 'Summary and union' button (selection-filter icon) for combined area analysis
- Groups intersecting features by the selected field attribute
- Performs geometry union operations on features with identical attribute values
- Results show combined areas for each unique attribute value
- Useful for aggregating areas by categories (e.g., land use types)
- Final calculations are displayed in hectares with proper styling

Reset Function (Reset Button):
- Click the reset button (reset icon) to clear the current analysis
- Removes all graphics from the map
- Clears the analysis boundary polygon
- Removes any temporary result layers
- Hides the Feature Table if visible
- Deactivates any active drawing or selection modes

Advanced Features
Spatial Intersection Analysis:
- Uses ArcGIS geometry operators for precise geometric calculations
- Performs true spatial intersection between boundary and analysis features
- Handles complex polygon geometries with multiple rings and vertices
- Calculates areas using geodetic measurements for accuracy
Dynamic Layer Management:
- Automatically updates layer lists when map layers change
- Maintains layer selections when possible during updates
- Creates temporary result layers with proper symbology
- Integrates seamlessly with the map's layer management system
Results Dialog:
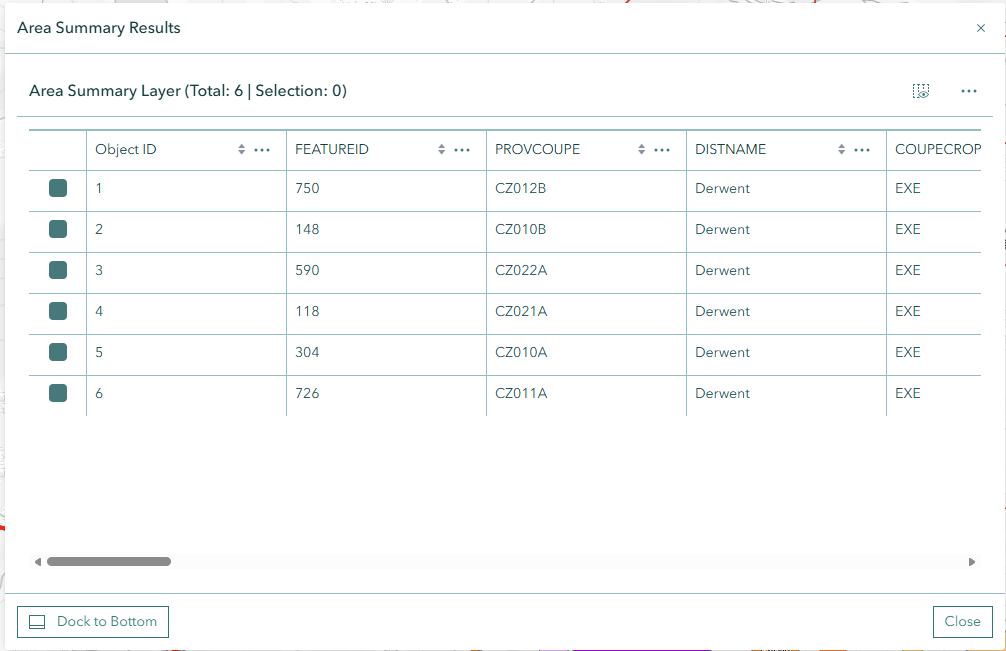
- Results open in a draggable, resizable Area Summary Results dialog
- The dialog can be repositioned and resized to suit your workspace
- Use the Hide Config / Show Config toggle to collapse or expand the left sidebar
- Displays results in an interactive results table with multi-sort and selection capabilities
- Columns include Object ID, the selected attribute field, and a CALCULATED_AREA column showing the intersected area in hectares (2 decimal places)
- Row selection: Click a row to highlight the corresponding feature on the map and automatically zoom to its geometry; multi-selection is supported
- Click Dock to Bottom to move the results table to the bottom panel for a wider view; the dialog closes and the bottom panel becomes active
- Click the undock button in the bottom panel to return results to the floating dialog
- Click Close to dismiss the dialog and clean up temporary layers and resources
Map Image Layer Sublayer Support:
- Map Image Layers with polygon sublayers are supported in both the geometry and analysis layer dropdowns
- Sublayers are listed individually; when duplicate sublayer names exist across different parent layers, the parent layer name is appended for disambiguation (e.g., "Parcels (Cadastre)")
- For polygon selection from Map Image Layers, the tool uses the ArcGIS Identify service as a fallback when hit-test is not available
- Map Image sublayers are automatically converted to temporary Feature Layers for analysis and table display
Partial Results and Error Handling:
- If some features fail to process during analysis (e.g., due to geometry errors), the tool returns partial results and displays a notice: "X of Y features could not be processed due to geometry errors"
- Successfully processed features are still shown in the results table
- If no features intersect the analysis boundary, an alert is displayed: "No features found for area analysis"
- SQL injection patterns are validated and blocked in filter expressions
Geometry Union Operations:
- Groups features by selected attribute values
- Performs geometric union on features with identical attributes
- Reduces visual complexity by combining overlapping areas
- Maintains attribute information through the union process
Performance Optimizations
Advanced Layer Caching System:
- Implements high-performance caching for both Feature Layers and Map Image Layers with sublayers
- Automatically caches visible layers with complete field information for instant access
- Tracks component usage analytics for performance monitoring and optimization
- Provides intelligent fallback to traditional layer enumeration if cache fails
- Significantly reduces load times for repeated operations on large datasets
Smart Geometry Operator Management:
- Lazy loads ArcGIS geometry operators (union, intersection, geodetic area) only when required
- Pre-validates operator availability before performing calculations to prevent errors
- Ensures geodetic area operators are loaded for accurate area measurements
- Optimizes memory usage by loading operators on-demand
Efficient Memory Management:
- Implements comprehensive cleanup of graphics, layers, and event handlers
- Automatically removes temporary result layers and graphics when resetting or closing
- Properly manages results table lifecycle to prevent memory leaks
- Maintains clean map state between analysis sessions
- Removes click handlers and drawing event listeners when switching modes
Practical Tips
Efficient Analysis:
- Start with smaller areas for quick validation
- Use simple polygons for initial calculations
- Gradually increase complexity as needed
Data Quality:
- Verify layer attributes before analysis
- Check for data completeness
- Validate results against known values
Performance Optimization:
- Close unnecessary layers
- Clear previous analyses when starting new ones
- Monitor system resources during large calculations
Troubleshooting
| Issue | Solution |
|---|---|
| Calculation fails | Verify polygon completion and ensure analysis layer is selected |
| No layers appear in dropdowns | Ensure layers are visible and are feature layers |
| Cannot select polygon geometry | Verify the geometry layer contains polygon features |
| Results seem incorrect | Check layer projection and spatial reference systems |
| Tool not responding | Refresh browser, clear cache, and check console for errors |
| Layer not selectable | Ensure layer is visible and properly loaded |
| Feature Table not showing | Check if center shell panel is properly initialized |
| Partial results returned | Some features have geometry errors; review the notice for details |
| Performance issues | Reduce polygon complexity or use smaller analysis areas |
Video Tutorial
Watch this comprehensive guide on using the Area Summary Tool:
See Also
- Filter Tool - Apply attribute and spatial filters to layer data
- Feature Table - View and manage feature attributes in tabular format
- Measure Tool - Quick distance and area measurements