Appearance
Canopy Analyze Tool
Overview
The Canopy Analyze Tool enables you to perform detailed statistical analysis of forest canopy heights within custom-defined areas. This tool provides precise height statistics including maximum, minimum, average, and standard deviation values.
Key Features
- Flexible Area Definition: Draw custom polygons or use preset shapes (boxes and circles)
- Preset Shape Tools: Quick-create standard boxes and circles centered on your map view
- Interactive Shape Editing: Resize, rotate, and reposition analysis areas with transform tools
- Real-Time Area Display: See the current area size while drawing and editing
- Comprehensive Statistics: Get detailed canopy height metrics for your analysis area
- Area Validation: Built-in limits ensure optimal analysis performance (maximum 10 hectares)
- Precision Results: Statistics include max, min, average, standard deviation, pixel count, and area
How to Use the Canopy Analyze Tool
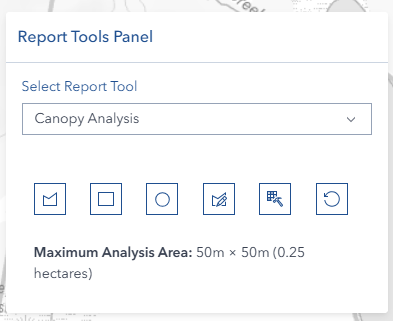
Accessing the Tool
- Navigate to the right panel in Horizon
- Locate and click the Canopy Analyze tool icon
- The tool panel will open showing drawing and analysis options
Defining Your Analysis Area

You have three ways to create an analysis area:
Option 1: Draw a Custom Polygon
- Click the Draw Polygon button (polygon icon)
- Click points on the map to define your boundary
- Continue clicking to add vertices as needed
- The polygon will complete automatically when finished
- The tool exits drawing mode after completion
Best for: Irregular areas, custom boundaries, specific plot shapes
Option 2: Create a Preset Box
- Click the Rectangle button to create a preset box
- The box appears centered on your current map view
- The shape automatically enters edit mode for immediate adjustment
- Resize using corner handles while maintaining aspect ratio
- Reposition by dragging the entire shape
Best for: Square sample plots, standard harvest units, regular grid analysis
Option 3: Create a Preset Circle
- Click the Circle button to create a preset circle
- The circle appears centered on your current map view
- The shape automatically enters edit mode for immediate adjustment
- Resize using edge handles while maintaining circular shape
- Reposition by dragging the entire shape
Best for: Circular sample plots, point-centered analysis, radial studies
Editing Your Analysis Area

Activate Edit Mode
- Click the Edit Geometry button (edit icon)
- Your shape displays with editing handles
- The button appearance changes to indicate active editing
Editing Tools

For Custom Polygons:
- Use reshape tools to adjust individual vertices
- Move vertices to refine your boundary
- The shape updates in real-time
**For Preset Shapes (Boxes and Circles): **
- Resize: Drag corner/edge handles to scale the shape
- Rotate: Use a rotation handle (boxes only)
- Move: Click and drag the shape to reposition
- Maintain Shape: Preset shapes preserve their form (boxes stay rectangular, circles stay round)
- Size Limits: Maximum dimension of 500 meters enforced automatically
Monitor Your Area Size
- Current Area Display shows live calculations while editing
- Area displayed in both hectares (ha) and square meters (m²)
- A warning appears if the area exceeds the 10-hectare maximum
- Area updates in real-time as you resize or reshape
Exit Edit Mode
- Click the Edit Geometry button again to finish editing, OR
- Click elsewhere on the map to exit edit mode
Running the Analysis
- Ensure your analysis area is defined and sized appropriately
- Check that the area is within the 10-hectare maximum limit
- Click the Analyze Canopy button (raster analysis icon)
- Wait while the analysis processes (loading indicator appears)
- Results display automatically in the results card
Understanding Your Results
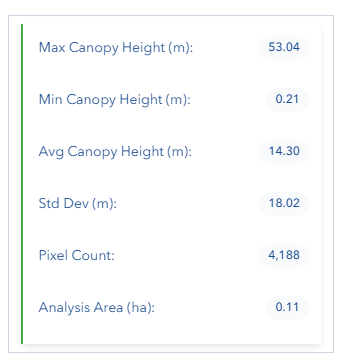
The result card displays comprehensive canopy height statistics:
Statistical Measures
- Max Canopy Height (m): The tallest canopy measurement within your area
- Min Canopy Height (m): The shortest canopy measurement within your area
- Avg Canopy Height (m): The mean canopy height across all pixels
- Std Dev (m): Standard deviation showing height variability
- Pixel Count: Number of data points analyzed
- Analysis Area (ha): Confirmed area size of your polygon
Resetting and Starting Over
Click the Reset button (reset icon) to:
- Clear your analysis area from the map
- Remove all result displays
- Return to a fresh state for new analysis
- Deactivate any active drawing or editing modes
Video Tutorials
Get area to Analyst
Troubleshooting
| Issue | Solution |
|---|---|
| Analysis button not responding | Verify area is drawn and within 10-hectare limit |
| "No geometry" error message | Draw or select an analysis area first |
| "Area too large" warning | Reduce analysis area size or divide into sections |
| Edit mode won't activate | Ensure an analysis area exists on the map |
| Preset shape doesn't appear | Check map is zoomed to appropriate scale |
| Can't resize preset shape | Verify edit mode is active (button highlighted) |
| Size limit exceeded warning | Reduce shape size to under 500m maximum dimension |
| No results displayed | Check Canopy Height Model layer is visible and loaded |
| Results seem incorrect | Verify analysis area is within data coverage zone |
| Shape disappears after editing | Click elsewhere on map or toggle edit button to complete |
| Analysis takes too long | Reduce area size; larger areas require more processing |
| Can't create new shape | Click Reset to clear existing analysis first |
Frequently Asked Questions
Q: How accurate are the canopy height measurements? A: The canopy height data comes from high-resolution LiDAR with 50cm × 50cm per pixel resolution, providing very precise measurements suitable for detailed forest analysis.
Q: Can I analyze multiple areas at once? A: No, analyze one area at a time. Use the Reset button between analyzes and document your results before moving to the next area.
Q: Why do preset shapes enter edit mode automatically? A: This allows you to immediately position and size the shape exactly where you need it, making the workflow faster and more efficient.
Q: What does "Pixel Count" mean in the results? A: Each pixel represents a 50cm × 50cm area on the ground. Pixel count shows how many data points were analyzed, indicating the detail level of your results.
Q: How should I interpret Standard Deviation? A: Standard deviation shows canopy height variability. Low values (0-5m) suggest uniform, even-aged forest. High values (10-20m) indicate mixed-age or structurally complex forest.
Q: Can I save my analysis results? A: Currently, results are displayed only during the session. Take screenshots or manually record statistics for documentation purposes.
Q: What happens if I click Analyze with area over 10 hectares? A: The system will prevent the analysis and display an error message showing your current area size and the maximum allowed limit.
Q: Why does the area display show different values while editing? A: The area calculation updates in real-time as you resize or reshape your analysis area, giving you immediate feedback on the size.