Appearance
Feature Table
Table of Contents
- Introduction
- Key Features
- Using the Feature Table
- Advanced Features
- Technical Specifications
- Best Practices
- Troubleshooting
- Video Tutorials
Introduction
The Feature Table is an advanced spatial data visualization and analysis tool that seamlessly integrates tabular data management with interactive map functionality. This sophisticated component provides a comprehensive bridge between spatial geometries and attribute data, enabling users to perform complex data exploration, analysis, and management tasks through an intuitive interface that combines ArcGIS FeatureTable widgets with custom geometry-based filtering and selection capabilities.
Key Features
Advanced Interactive Data Display:
- High-performance ArcGIS FeatureTable widget integration with comprehensive attribute visualization
- Dynamic layer caching system for optimized performance with large datasets
- Real-time synchronization between tabular data and map visualization
- Intelligent field management with automatic column configuration and sorting capabilities
Sophisticated Geometry-Based Filtering:
- Interactive drawing tools for custom polygon boundary creation with real-time preview
- Target selection capabilities with click-based feature selection from visible layers
- Advanced spatial intersection analysis using ArcGIS geometry operators
- Multi-layer support including FeatureLayers and CSV layers with comprehensive field access
Comprehensive Data Management:
- Temporary result layer creation with proper symbology and map integration
- Intelligent cleanup systems for graphics, layers, and event handlers
- Coordinate system transformation support using projectOperator for spatial accuracy
- Union operation capabilities for combining multiple geometries into complex analysis areas
Using the Feature Table
Accessing the Tool
- Launch the Feature Table:
- Locate the Feature Table icon
- Click to toggle visibility

Filter Configuration
Setting Up Filter Geometries
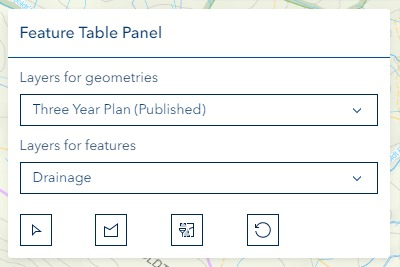
- Selection Method:
- Click "Select" icon for existing layers
- Use drawing tools for custom geometries

- Drawing Tools:
- Access via "Draw" icon
- Create custom filter shapes

- Filter Application:
- Apply filters using dedicated icon
- Reset as needed


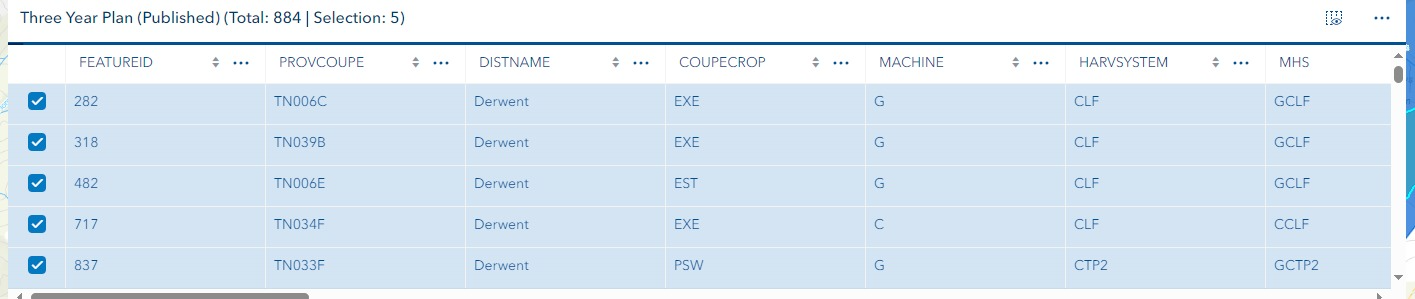
Data Management
- Feature Management:
- Access options via "Three-Dots" icon
- Control feature visibility
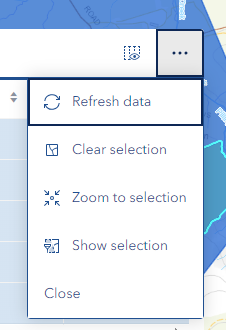
- Management Options:
- Selection clearing
- Zoom functionality
- Data export
Advanced Features
Custom Filtering:
- Complex geometry creation
- Advanced attribute queries
- Multiple filter combination
Data Integration:
- Cross-layer analysis
- Attribute correlation
- Spatial relationships
Export Functions:
- Multiple format support
- Custom field selection
- Batch processing
Technical Specifications
Supported Layer Types:
- Feature layers
- CSV layers
- Query layers
Performance Optimization:
- Dynamic loading
- Memory management
- Cache utilization
Data Handling:
- Large dataset support
- Error prevention
- Data validation
Best Practices
Filter Design:
- Start with broad filters
- Refine progressively
- Validate results
Performance Management:
- Limit selection size
- Use efficient queries
- Regular cache clearing
Data Organization:
- Structured attribute management
- Consistent naming conventions
- Regular backups
Troubleshooting
| Issue | Solution | Prevention |
|---|---|---|
| Table not populating | Verify layer selection and filters | Check layer compatibility |
| Slow performance | Optimize selection criteria | Limit data volume |
| Filter not working | Validate geometry and attributes | Test filters incrementally |
| Export failures | Check file permissions | Verify export settings |
Video Tutorials
Creating a Feature Table from a Custom Polygon
Creating a Feature Table from a Selected Polygon
The Feature Table is essential for:
- Data analysis and visualization
- Attribute management
- Spatial query execution
- Feature selection and filtering
- Data export and reporting
Key benefits include:
- Enhanced data exploration
- Improved attribute analysis
- Efficient feature selection
- Streamlined workflow
- Better data organization
Understanding and effectively utilizing the Feature Table enables:
- More efficient data management
- Better decision-making
- Enhanced spatial analysis
- Improved data quality control
- Streamlined reporting processes